Saving Variables
To save an insight on how a variable reacts to another, you can go to the options button next to the variable you are interested in, and click save insight.Saving Plots
If you want to save a plot you’ve composed, you can click the “Save Insight” button.Saving Graphs
To save a Graph as an Insight, you can click the “Save Insight” button in the upper right corner of the Graph view.Saving Correlations
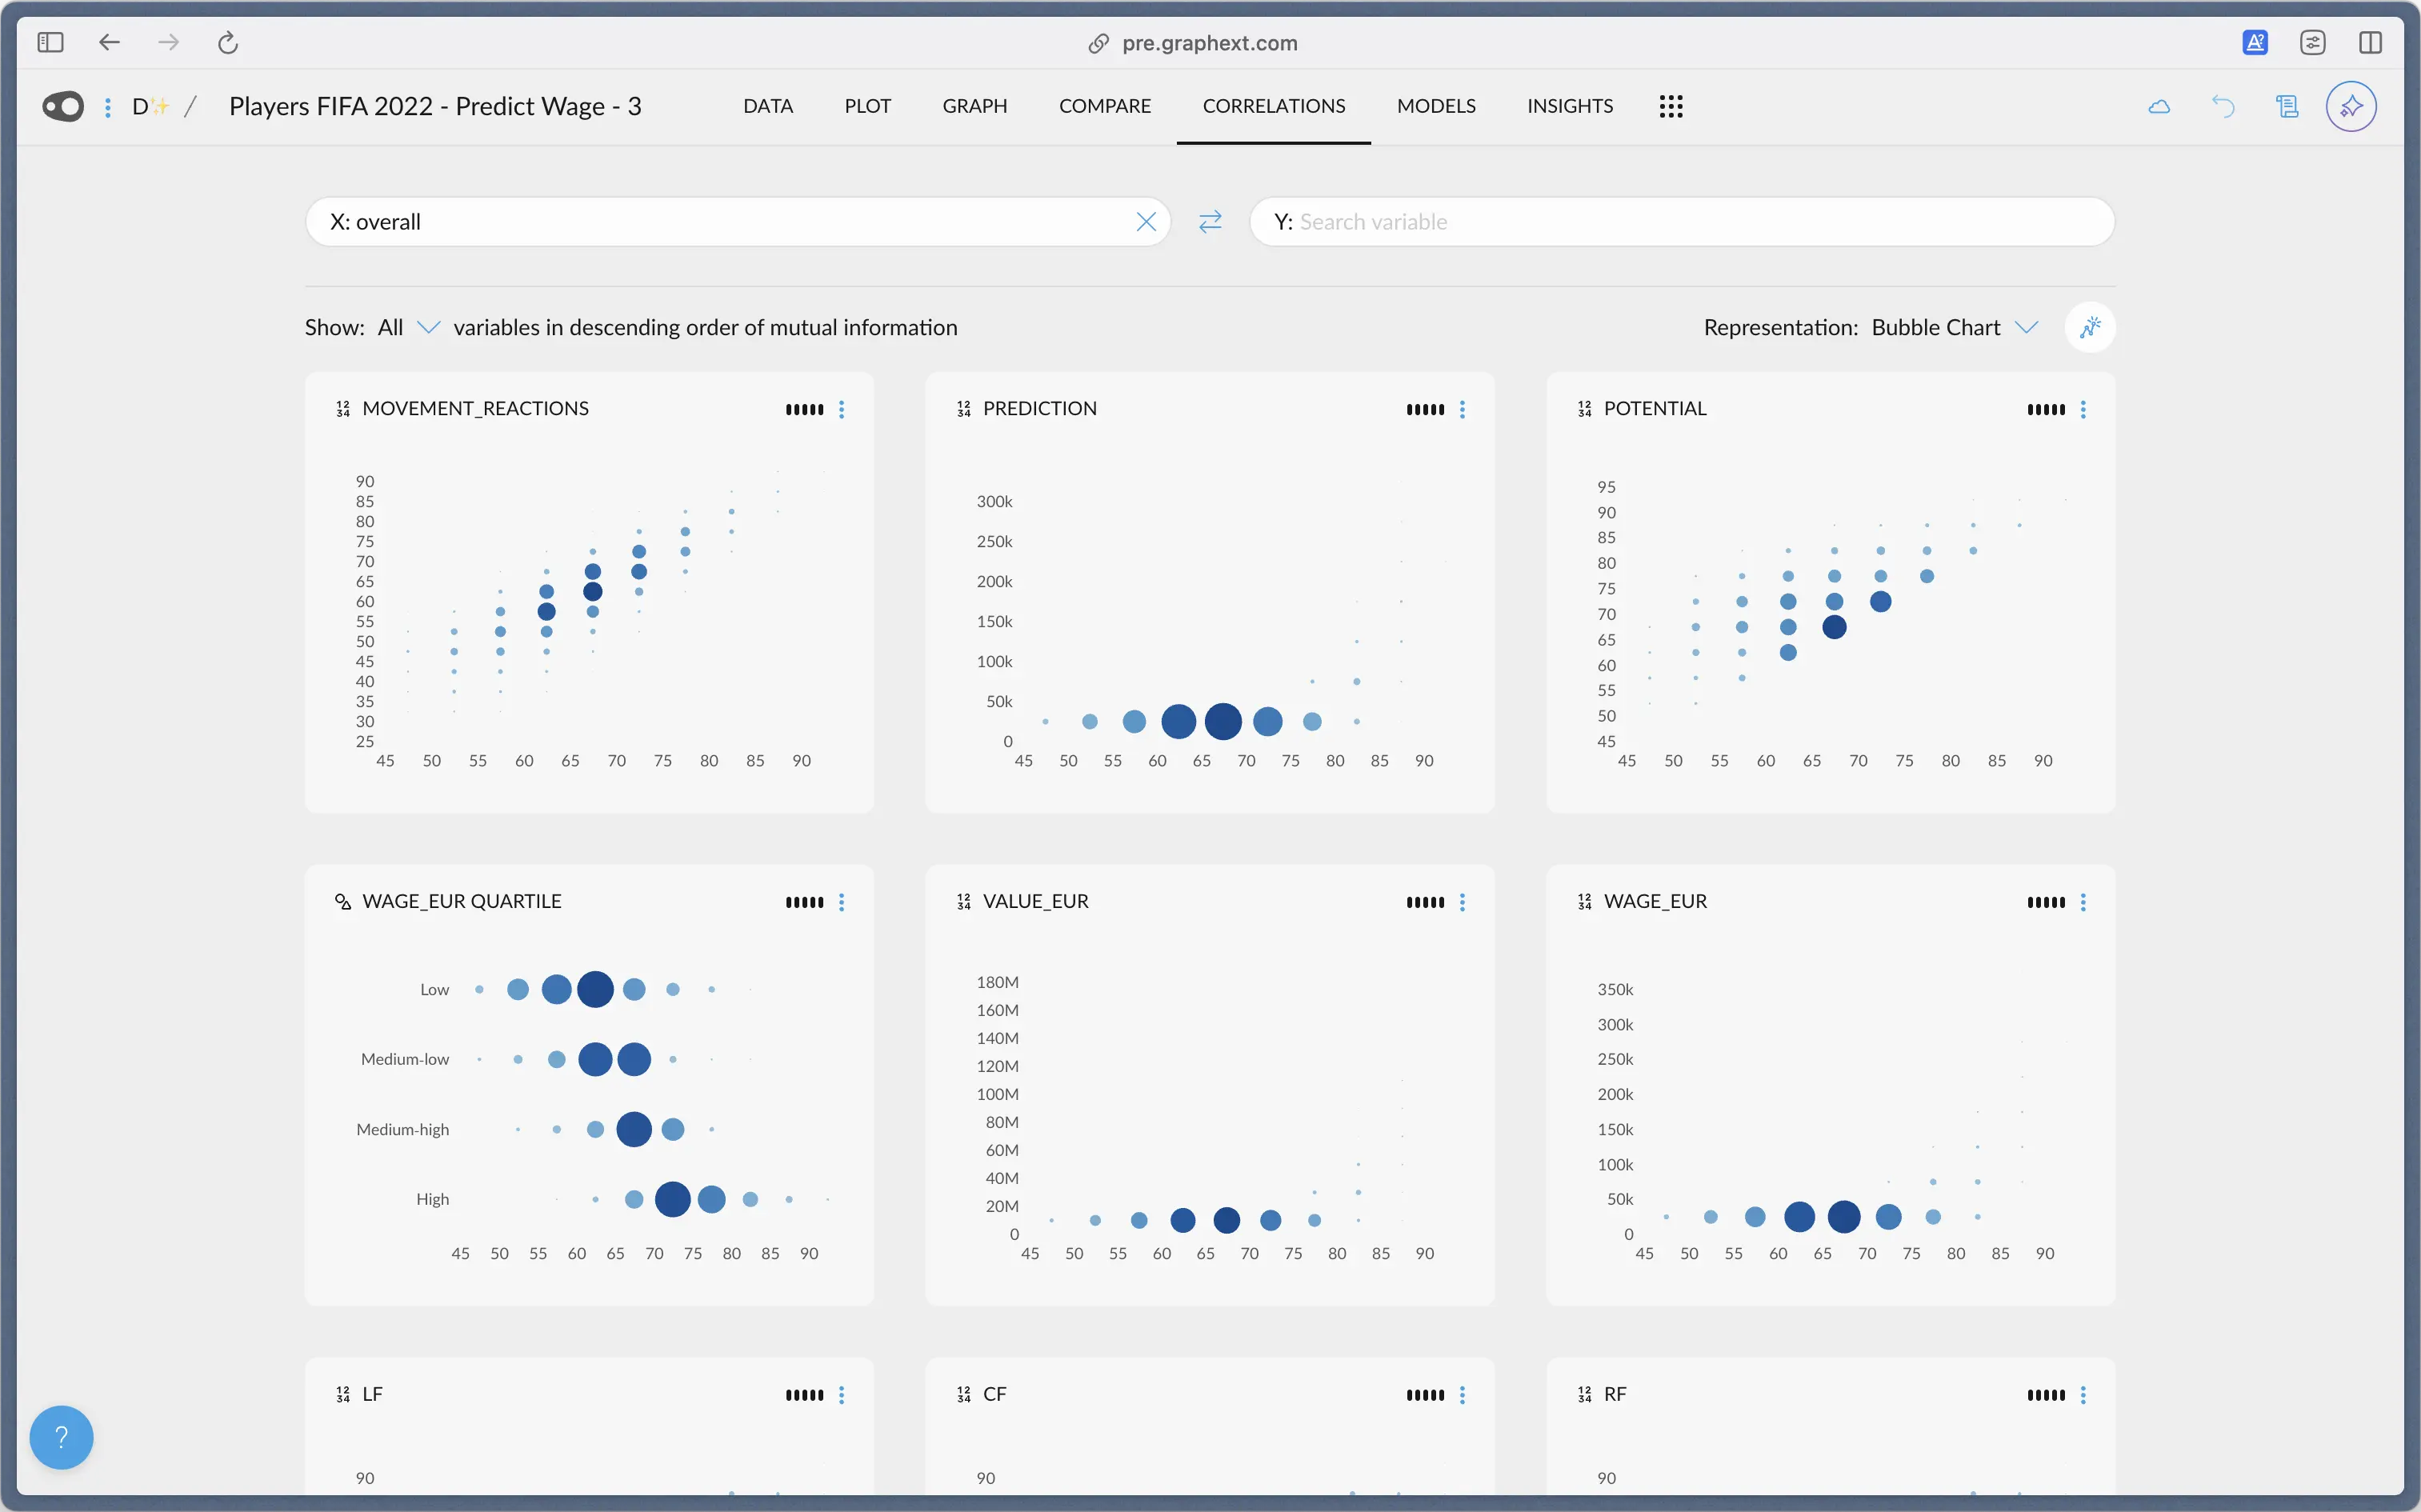
There are multiple ways to save correlations as insights. You may save a group of related correlations as an insight, or individual ones.Saving individual correlations
In order to save a correlation chart, navigate to the Correlations tab and click on the options, just as you would in the Data tab. Then, click “Save Insight”.Saving a group of correlations
In order to save a group of correlations, you can click on this button on the top right to save the first 5 charts visible at that point.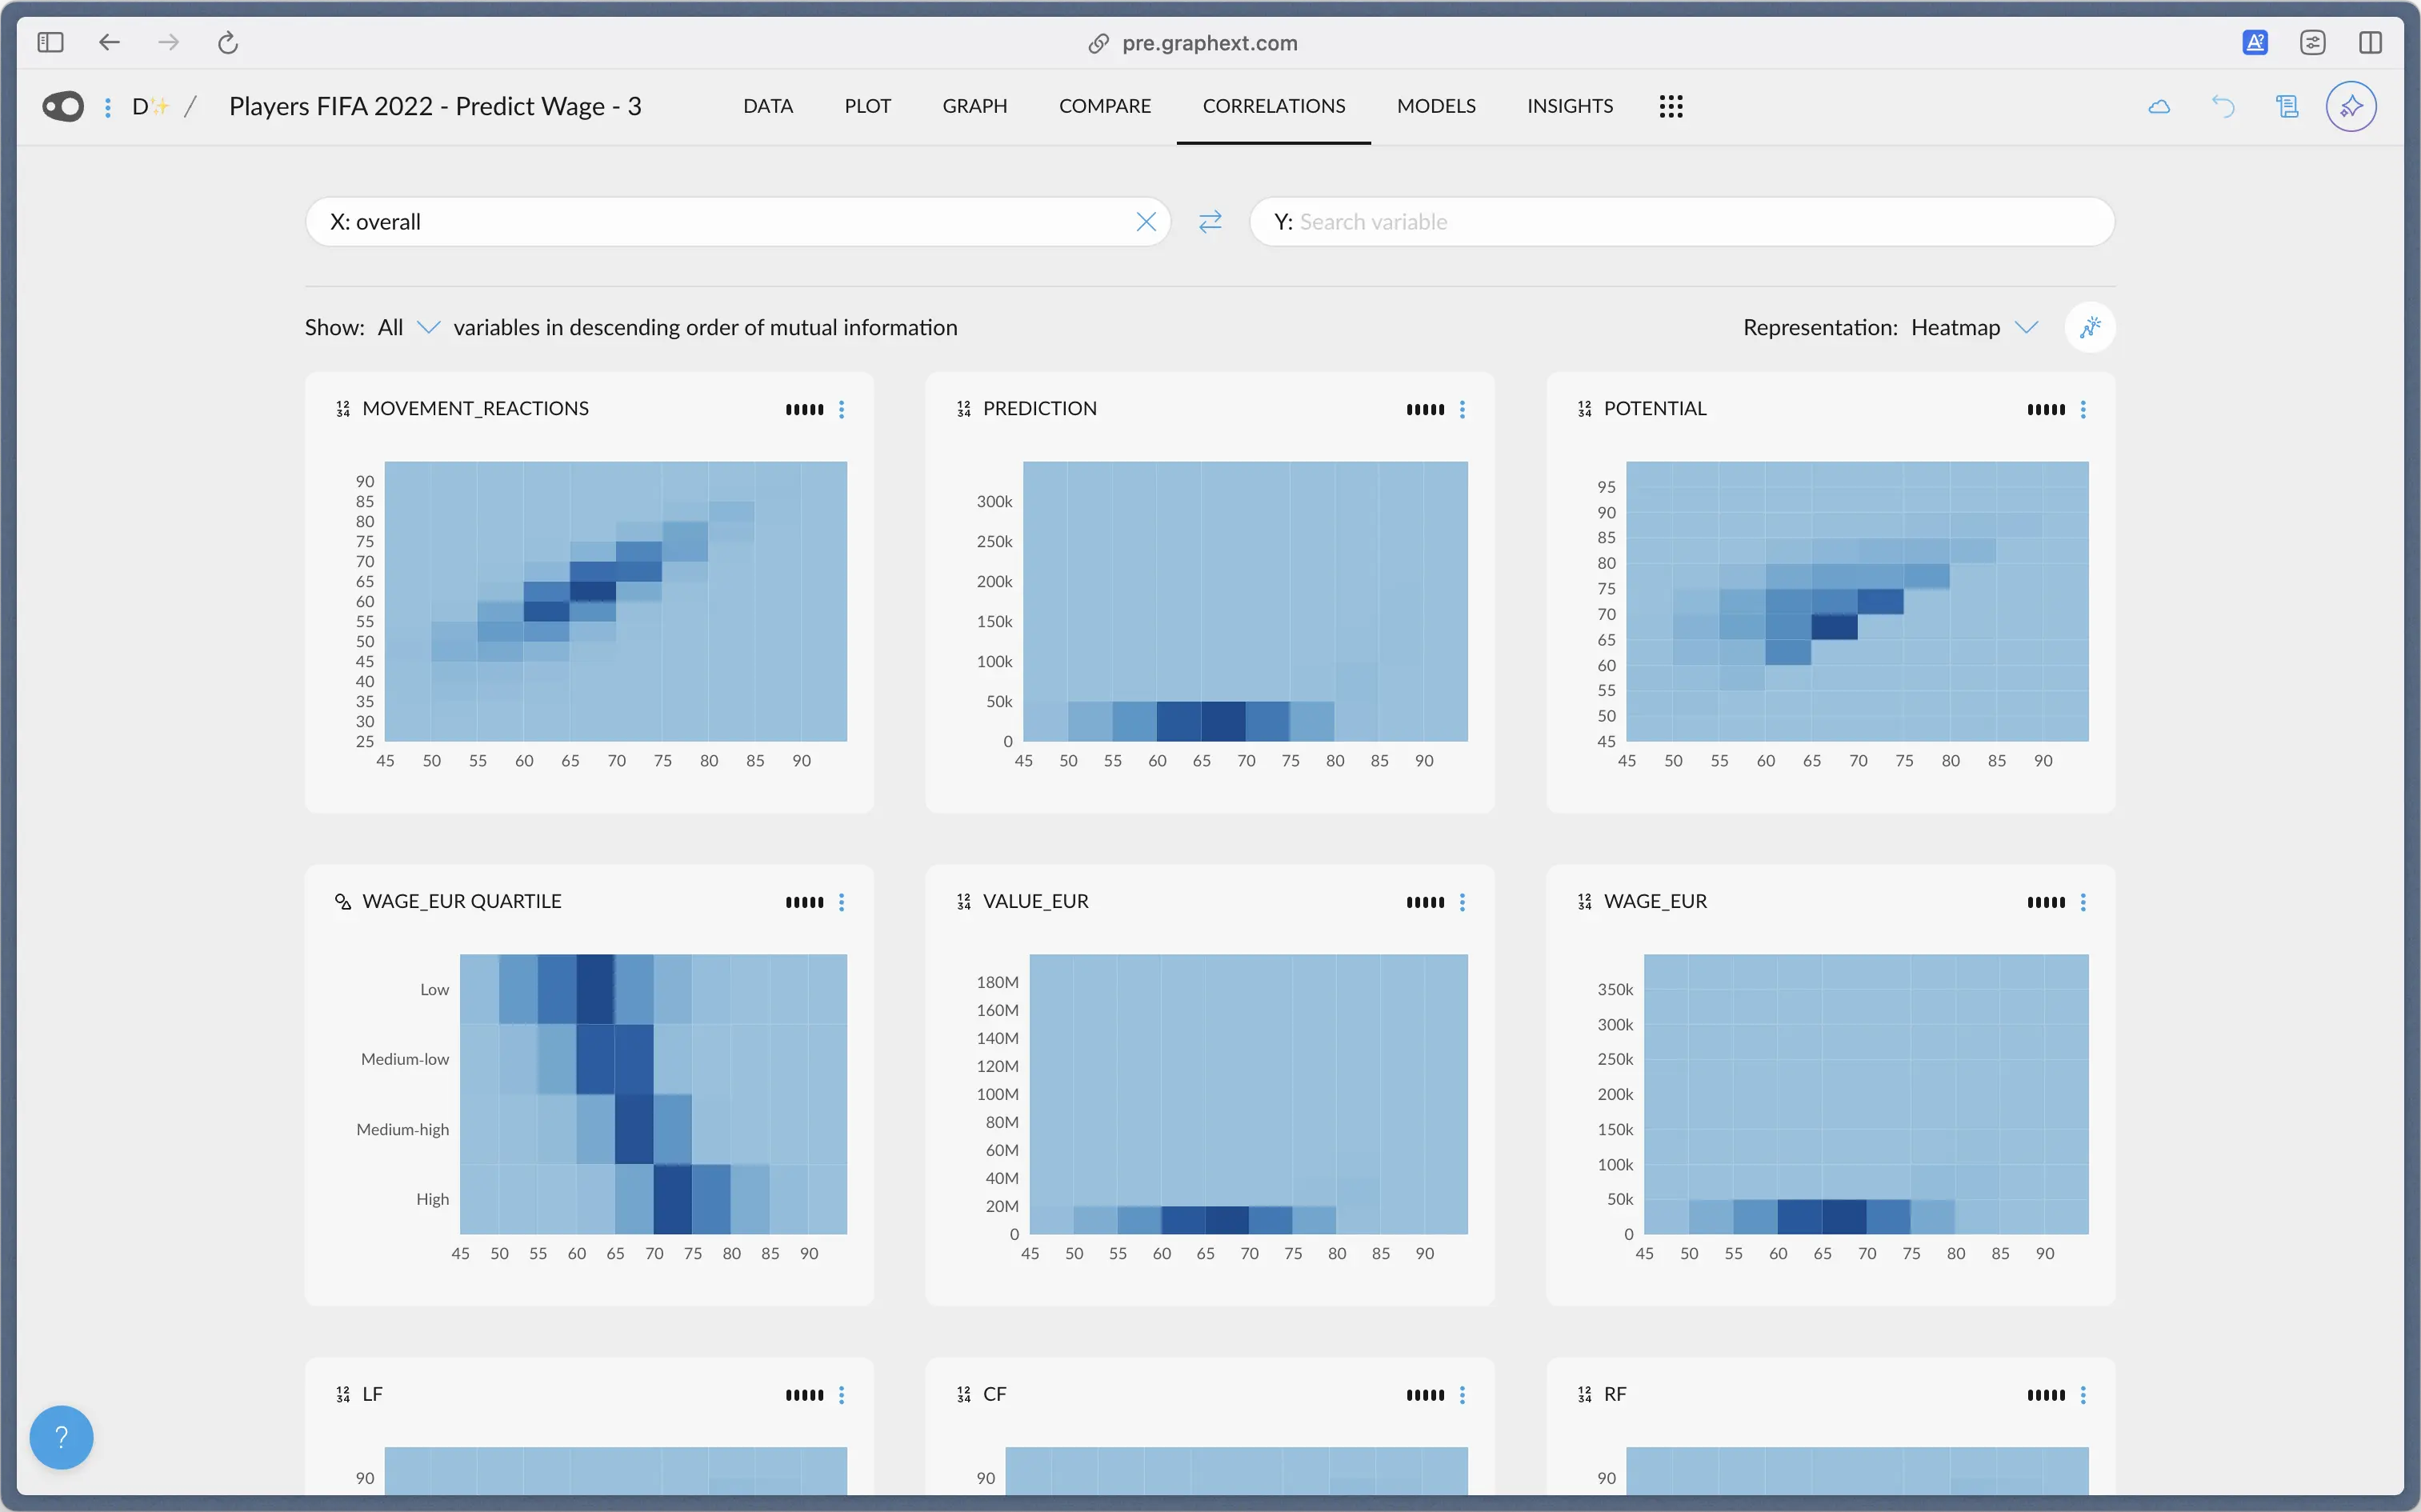
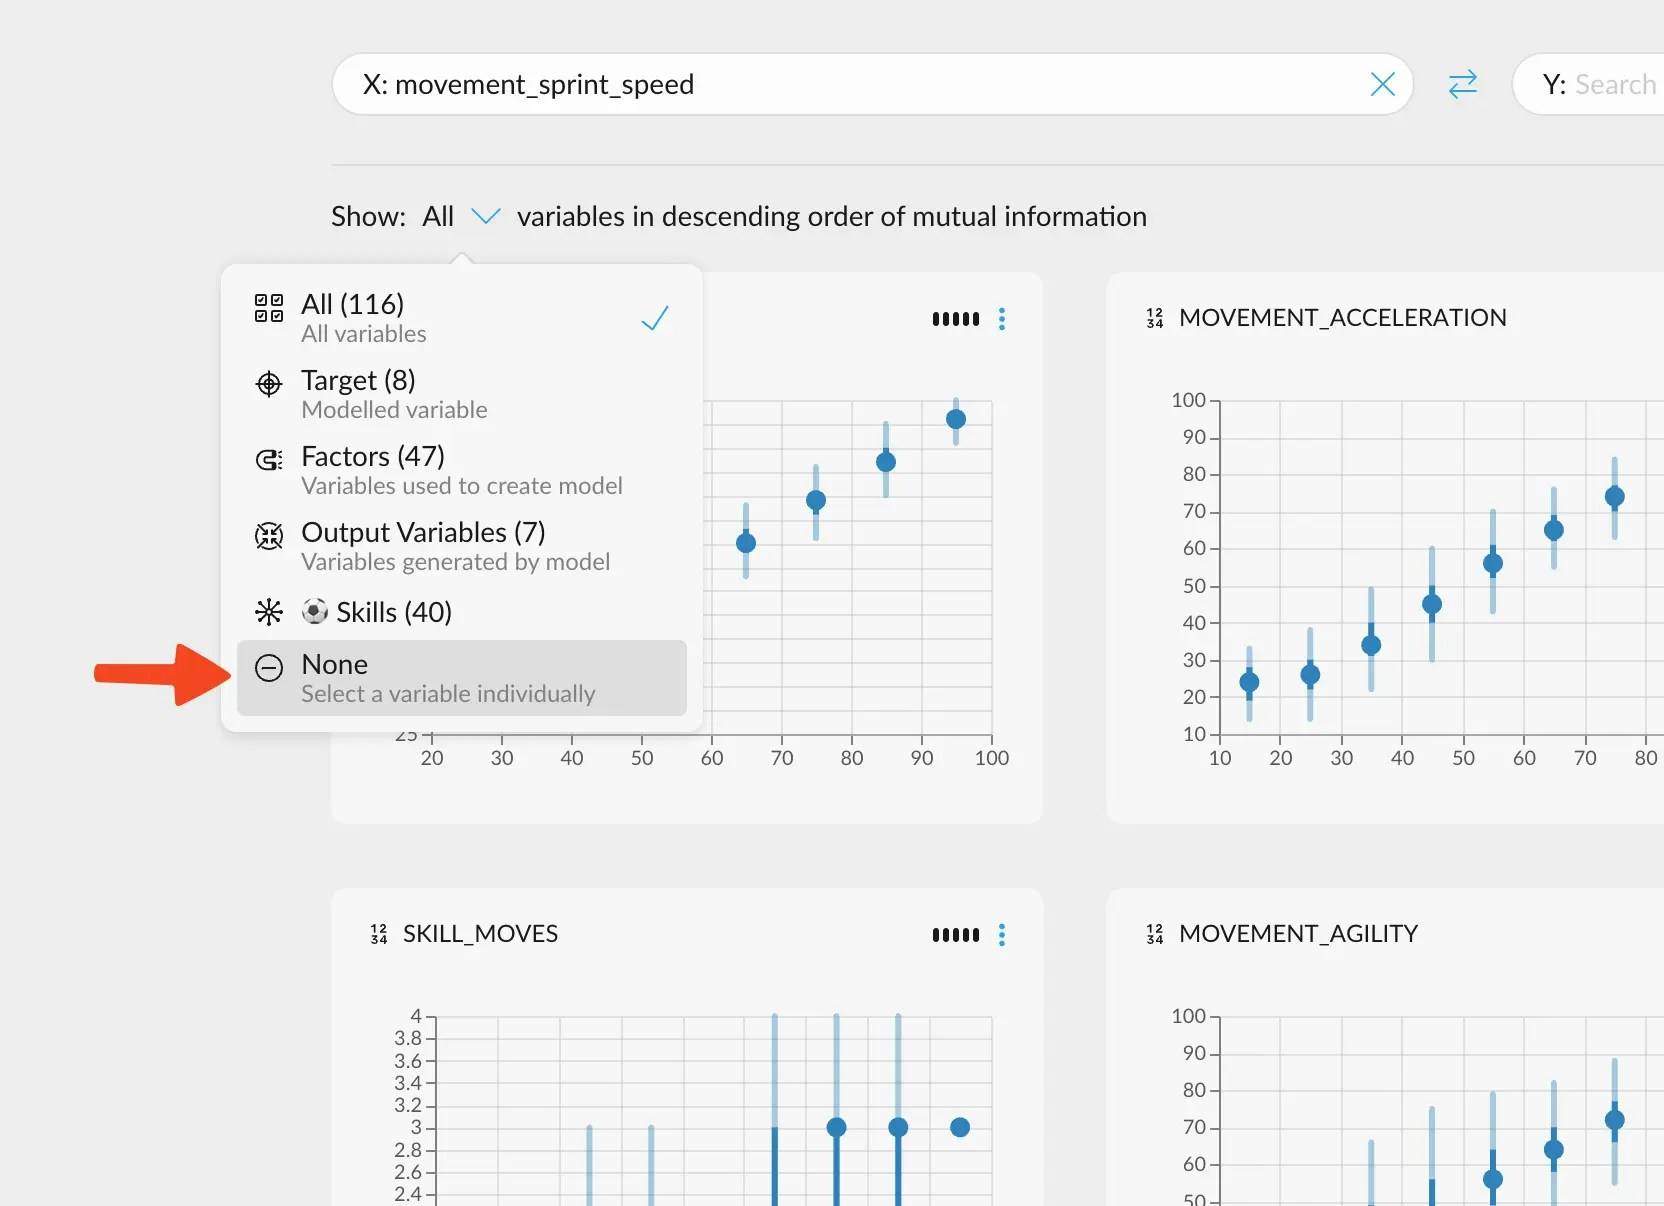
For this menu to appear, you need to have
Tags in your variables, since it’s the
only way you can filter variables in this manner at the moment.
Saving in Compare
To save an Insight from the Compare tab, you may proceed in the same way as with the Correlations tab.Accessing your insights
After creating your first insight, you’ll be able to access them from the Insights tab in the navigation bar up top.