A practical example
We can analyze this example to get a sense of how it works.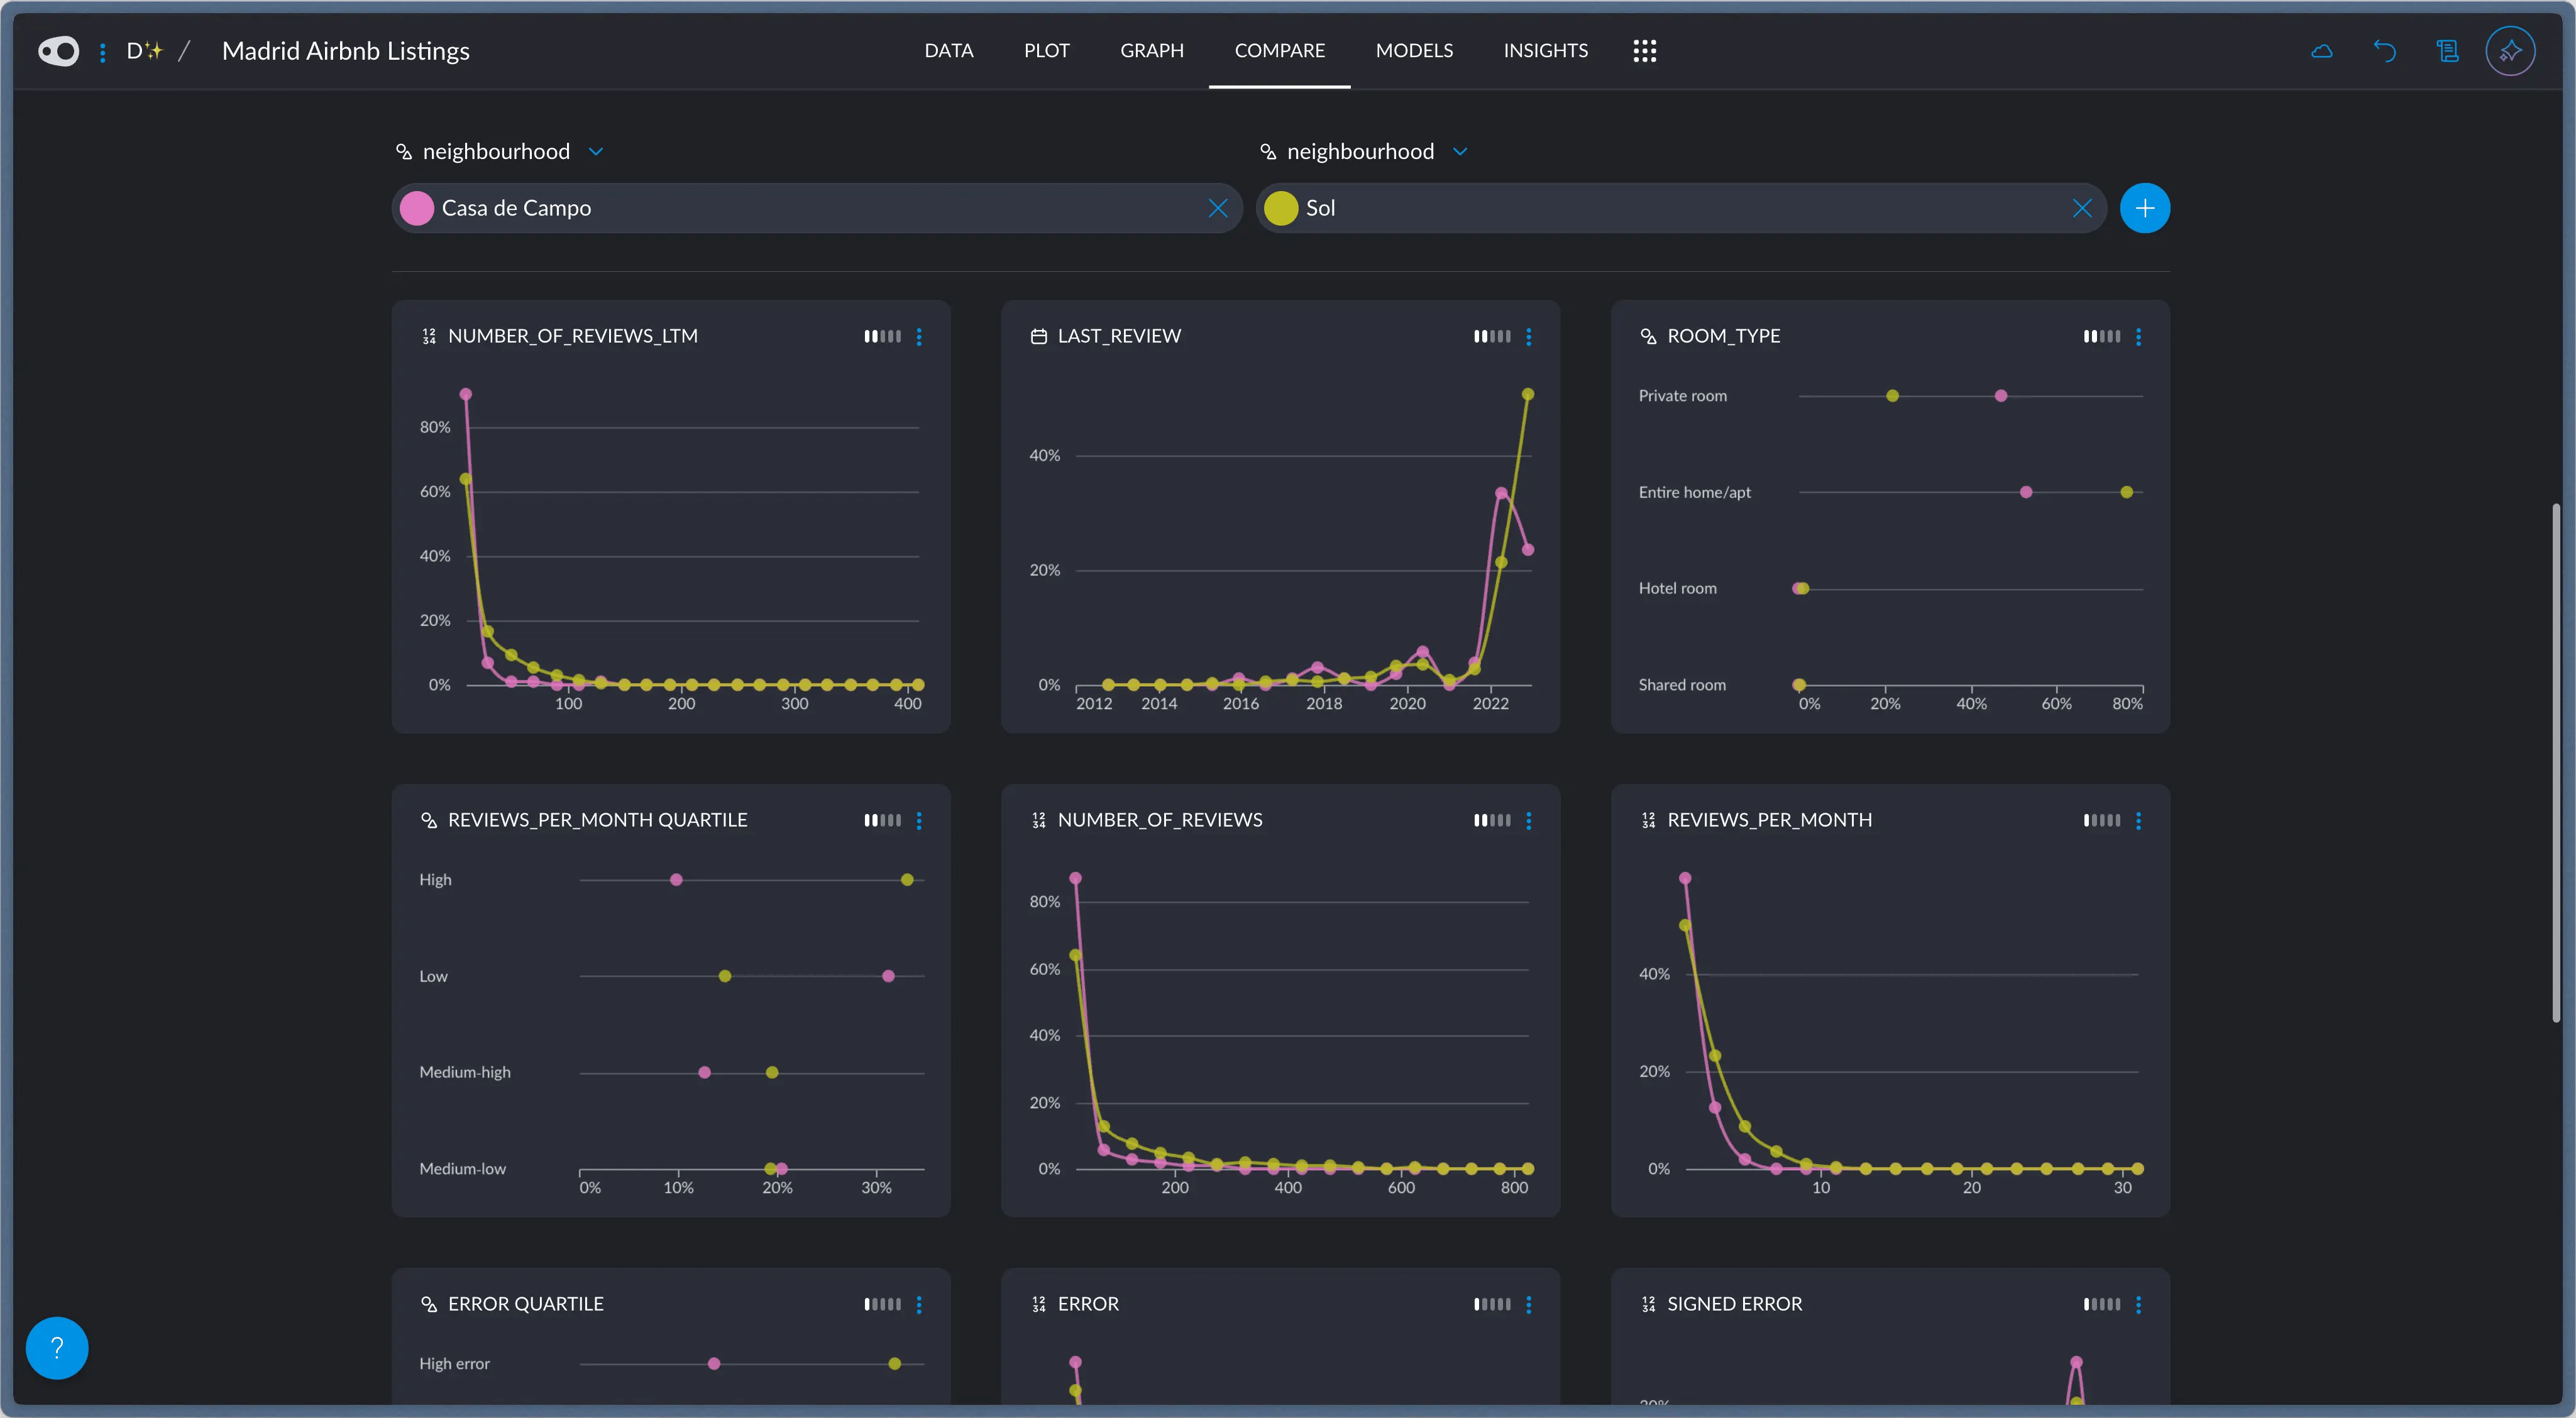
The Compare tab in a listing for Airbnbs in Madrid.
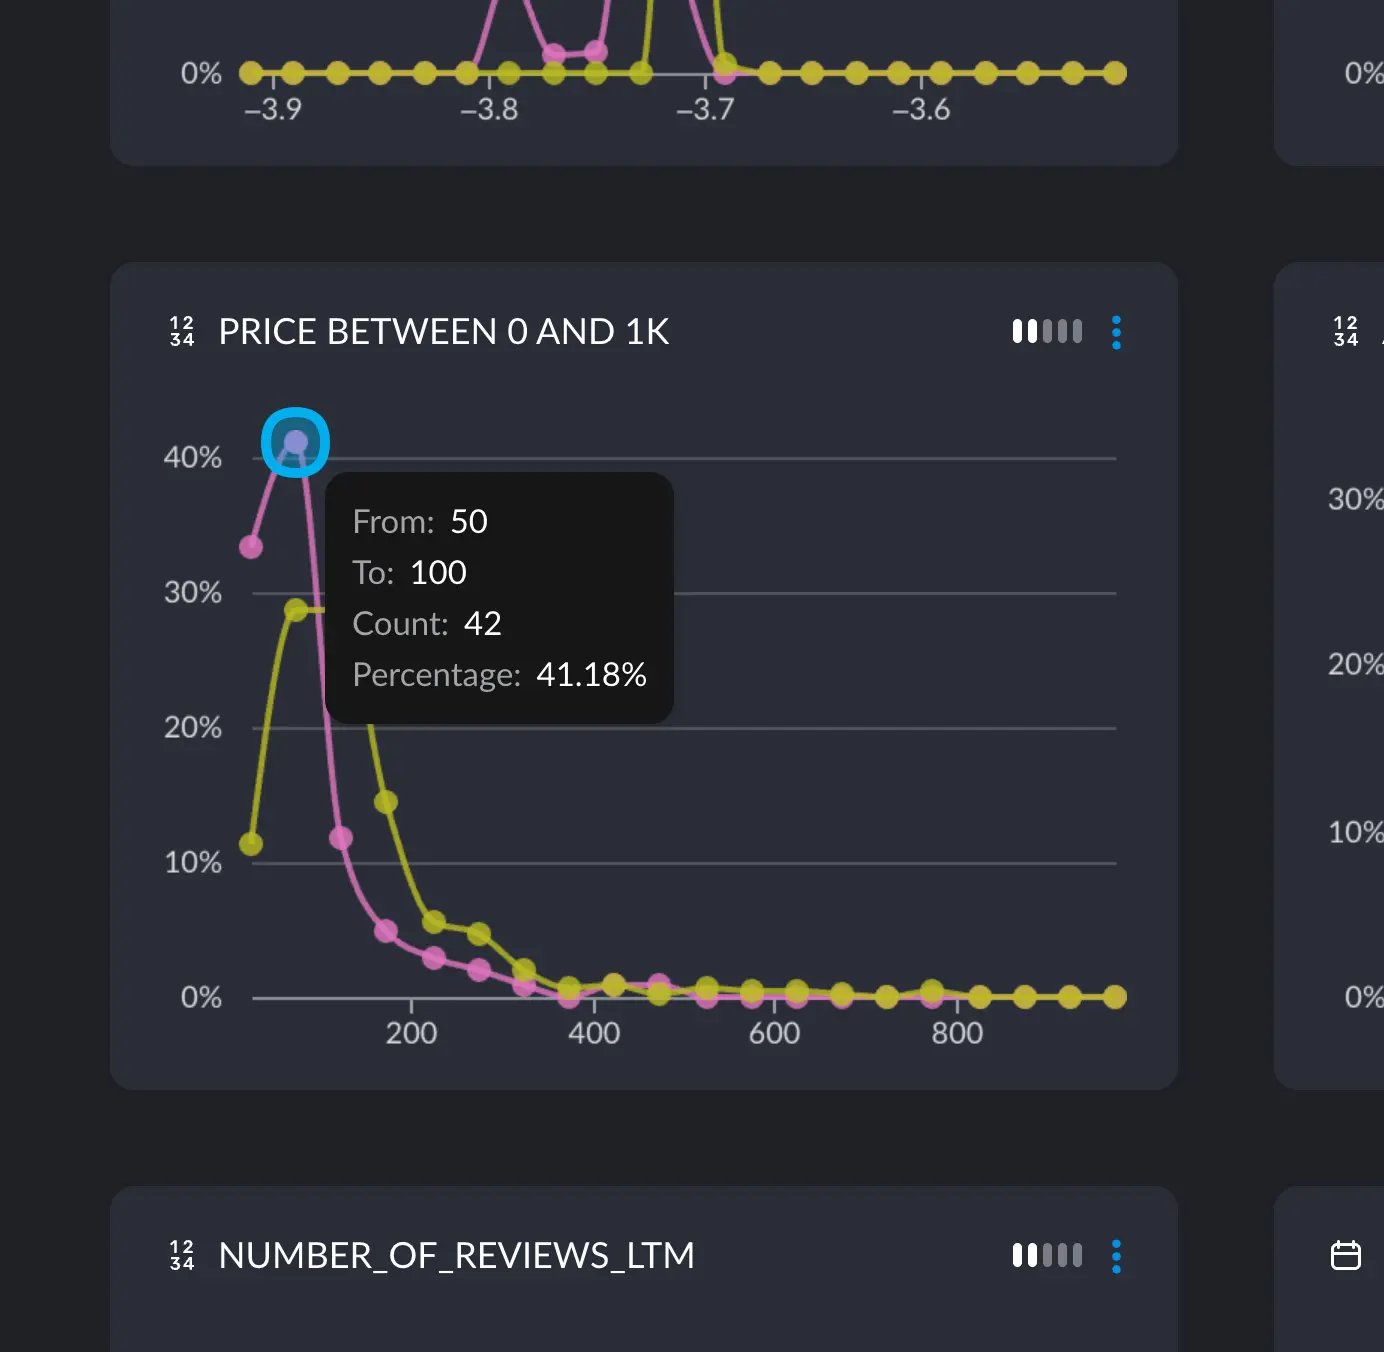
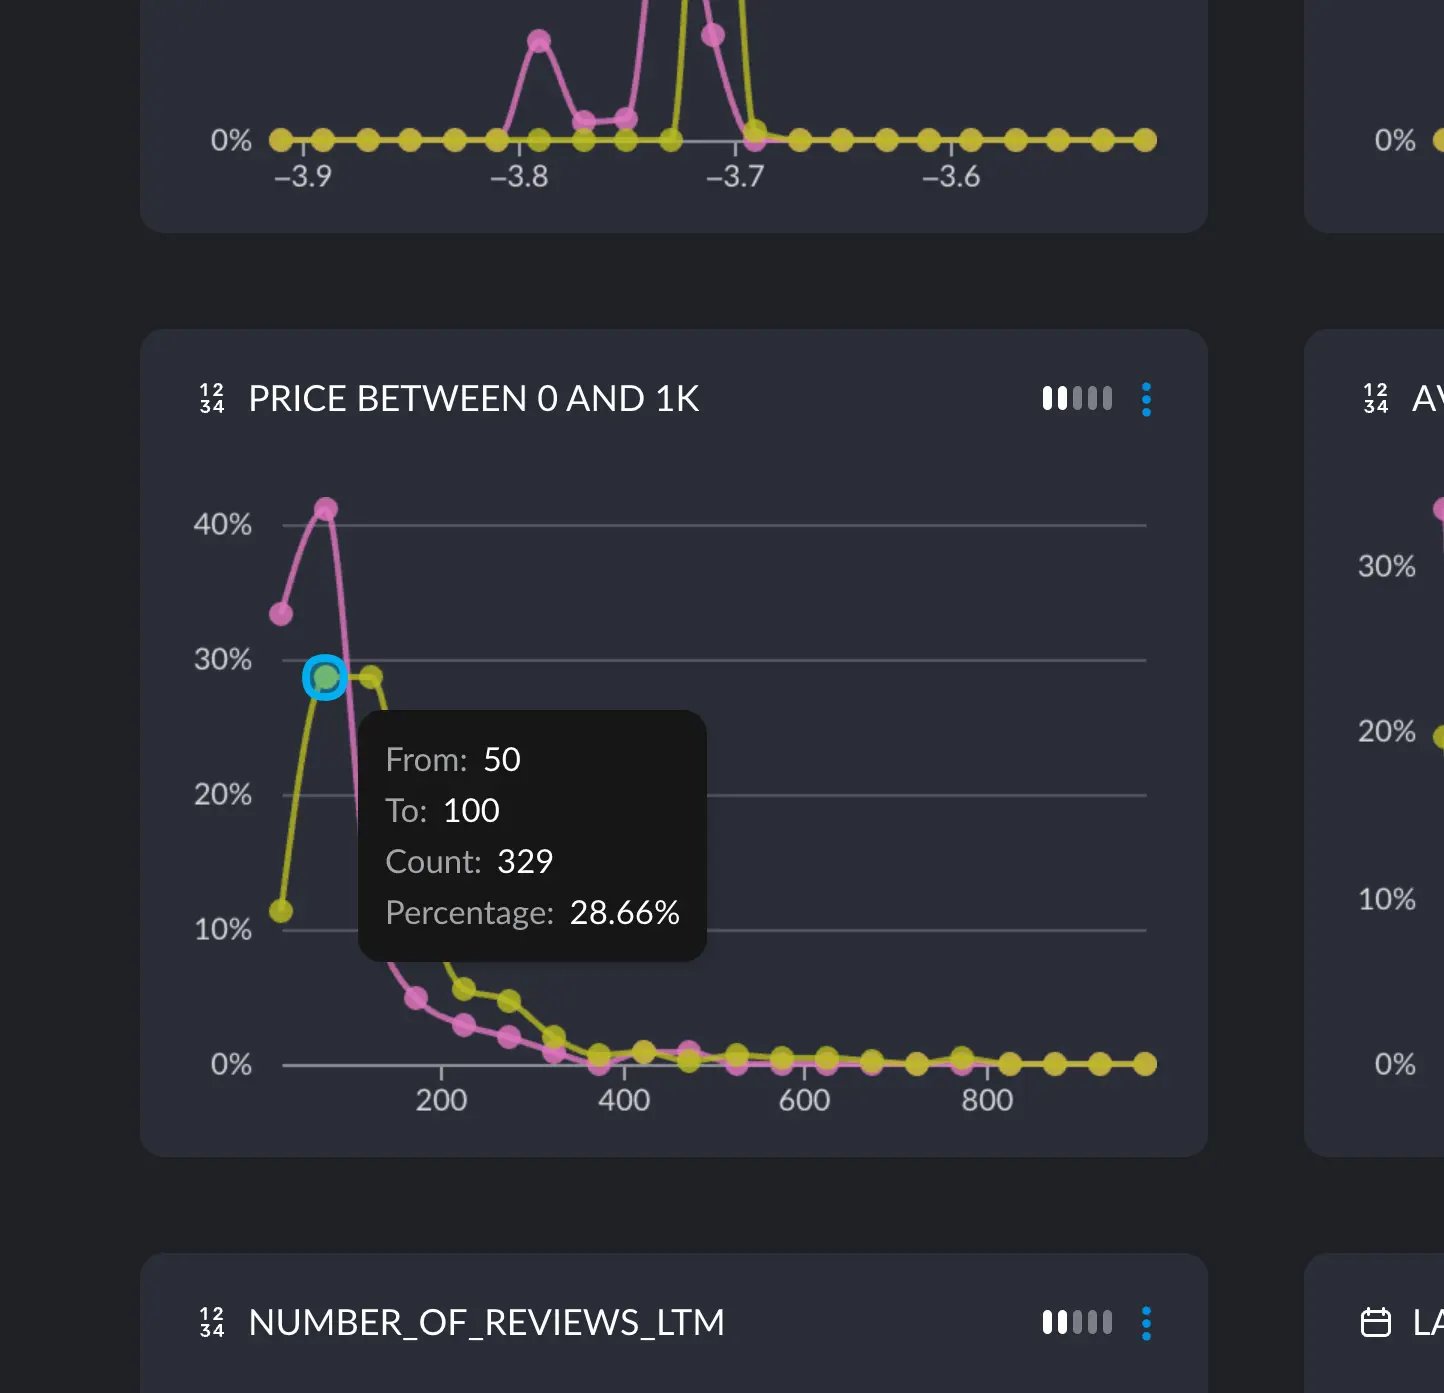
The price difference is quite apparent
Explore your data in a massively parallel way
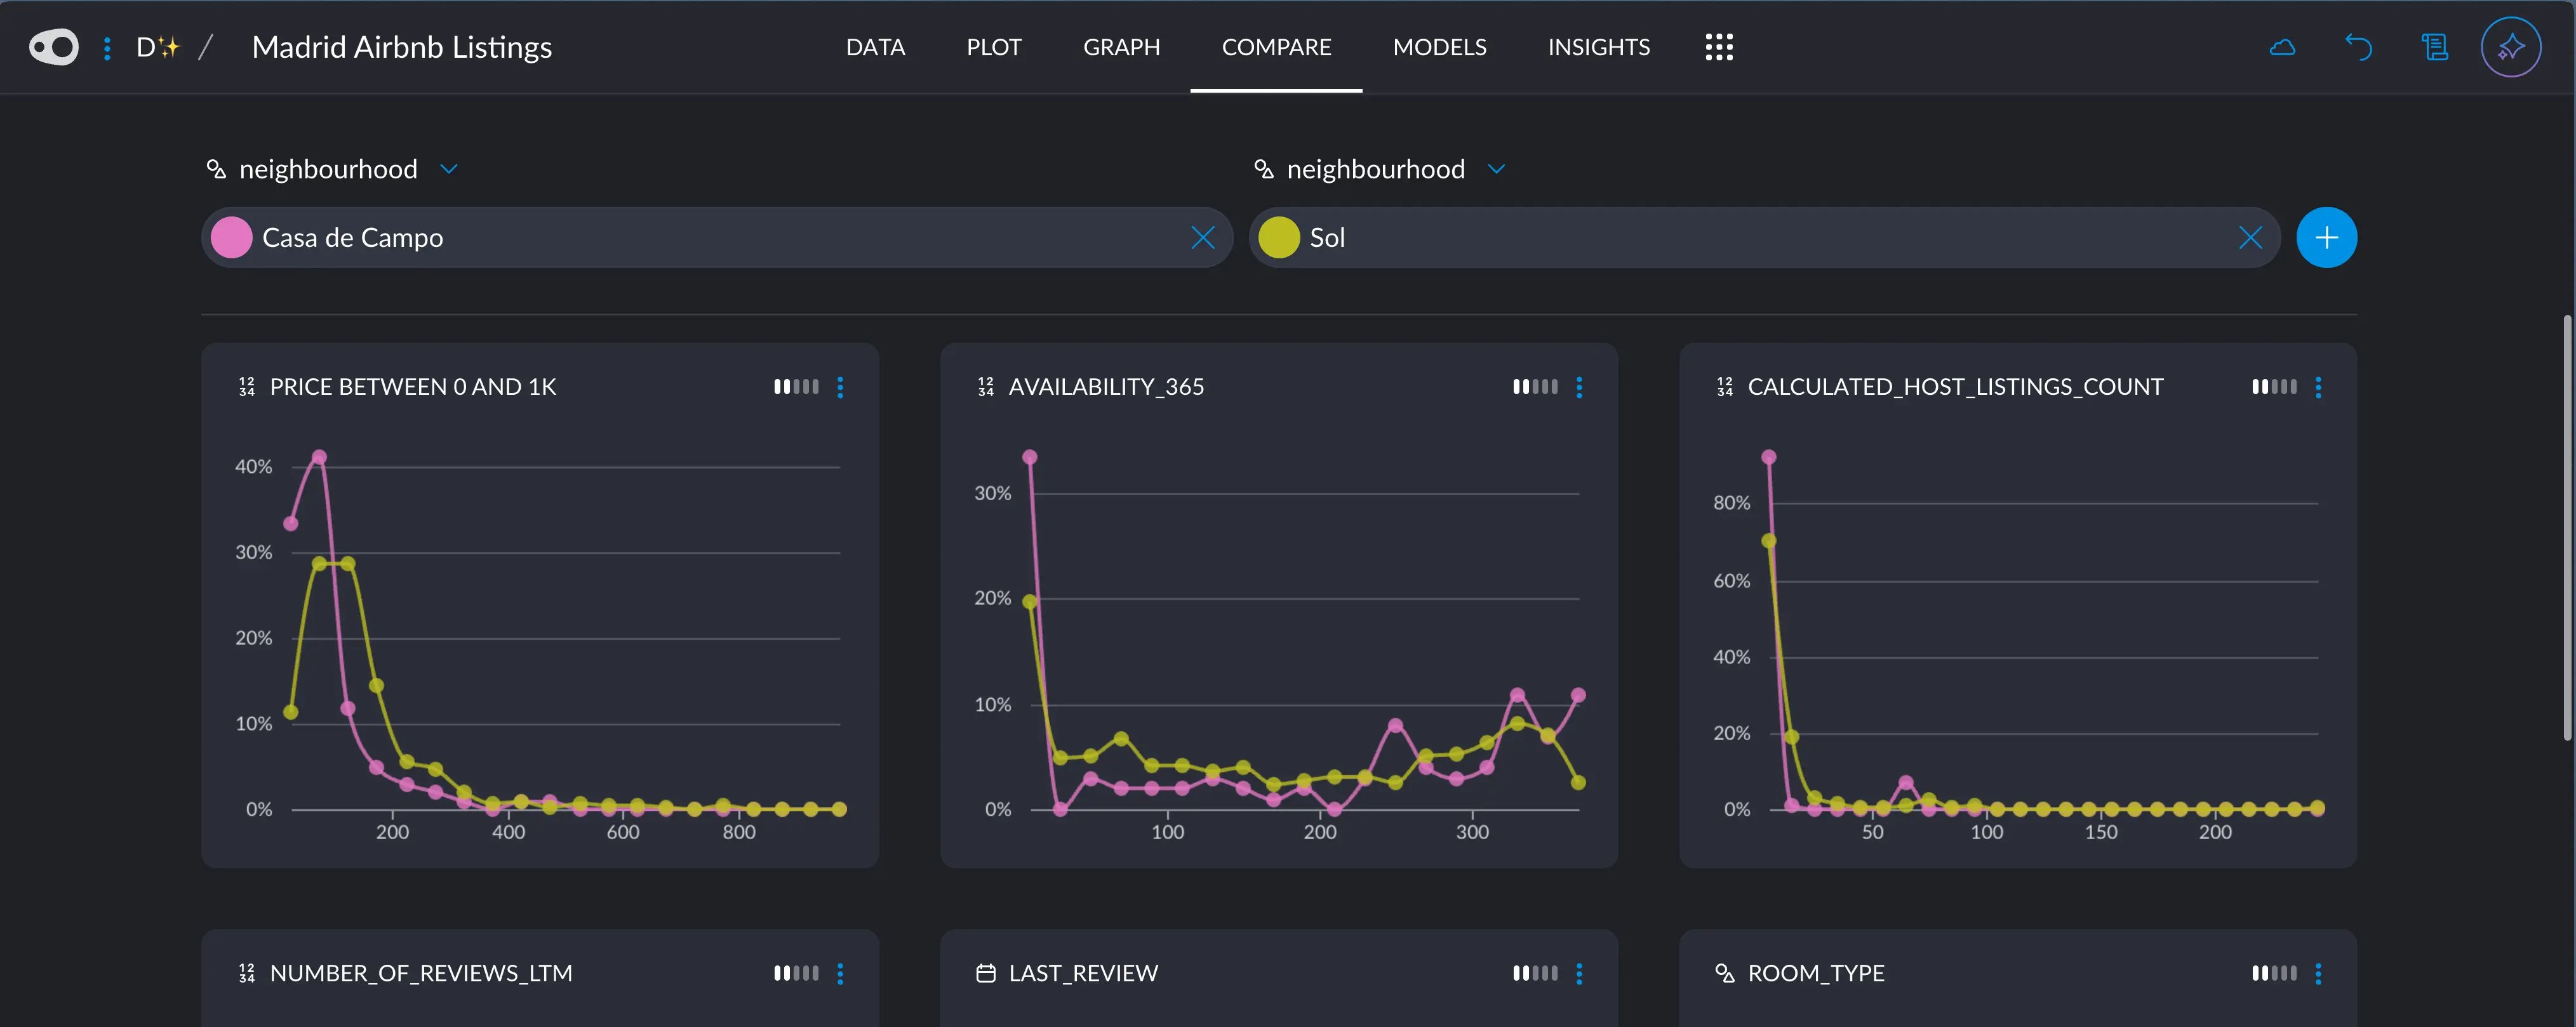
The Compare tab in a listing for Airbnbs in Madrid.
The price difference is quite apparent