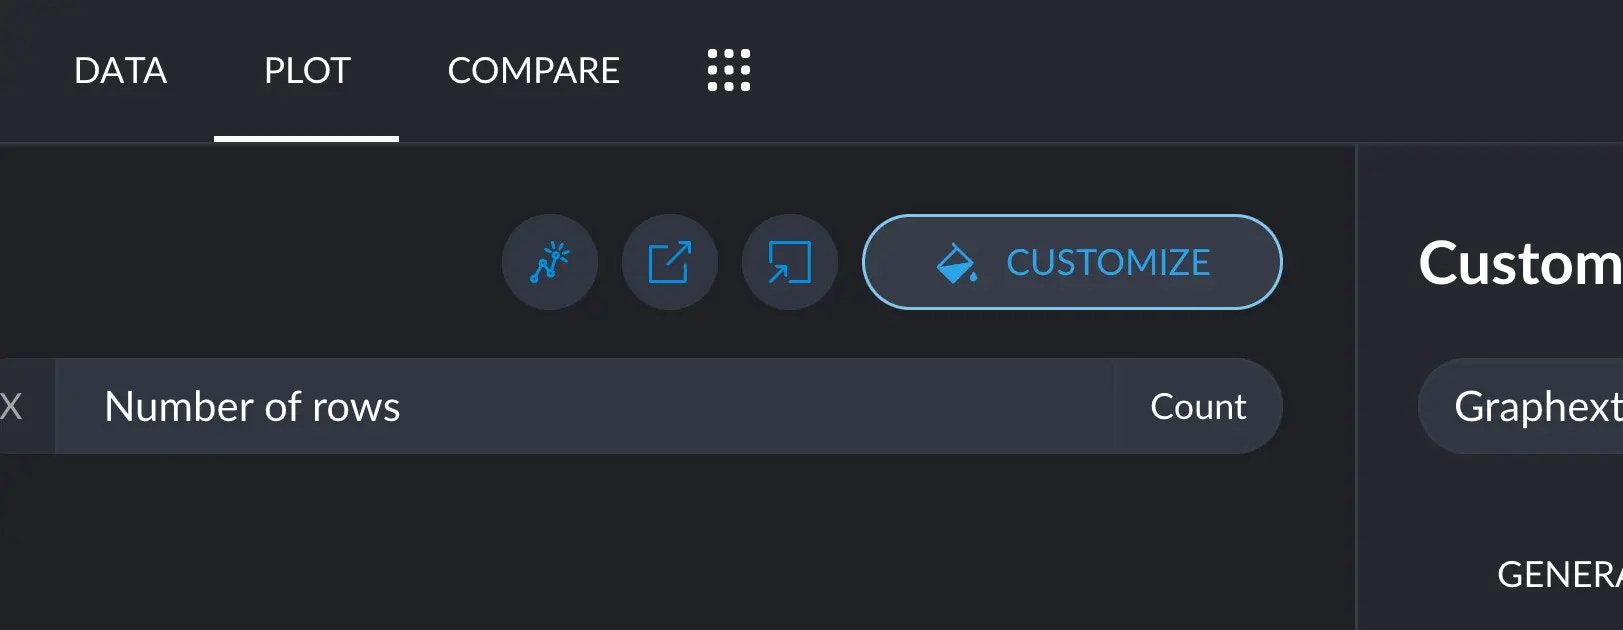
Plots can generally be highly customized. In any plot, click on the Customize button on the top right corner.
Filtering
While not immediately obvious, all the cross filters you have currently applied will actually show up in your plot, in real time. You can switch to the Data tab, hone in to a thin slice of your dataset, and come back to the Plot tab and continue editing your chart. All progress will be saved.Themes
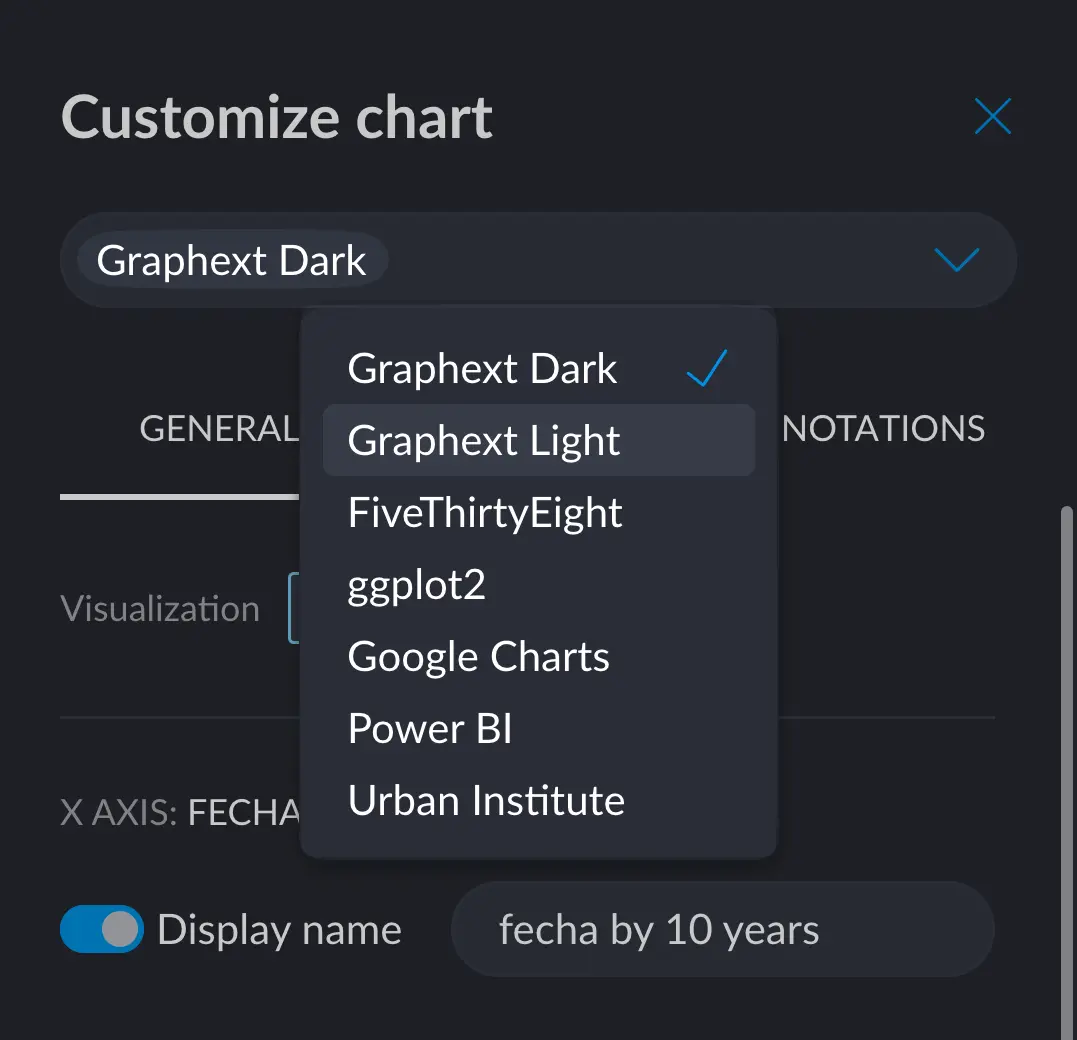
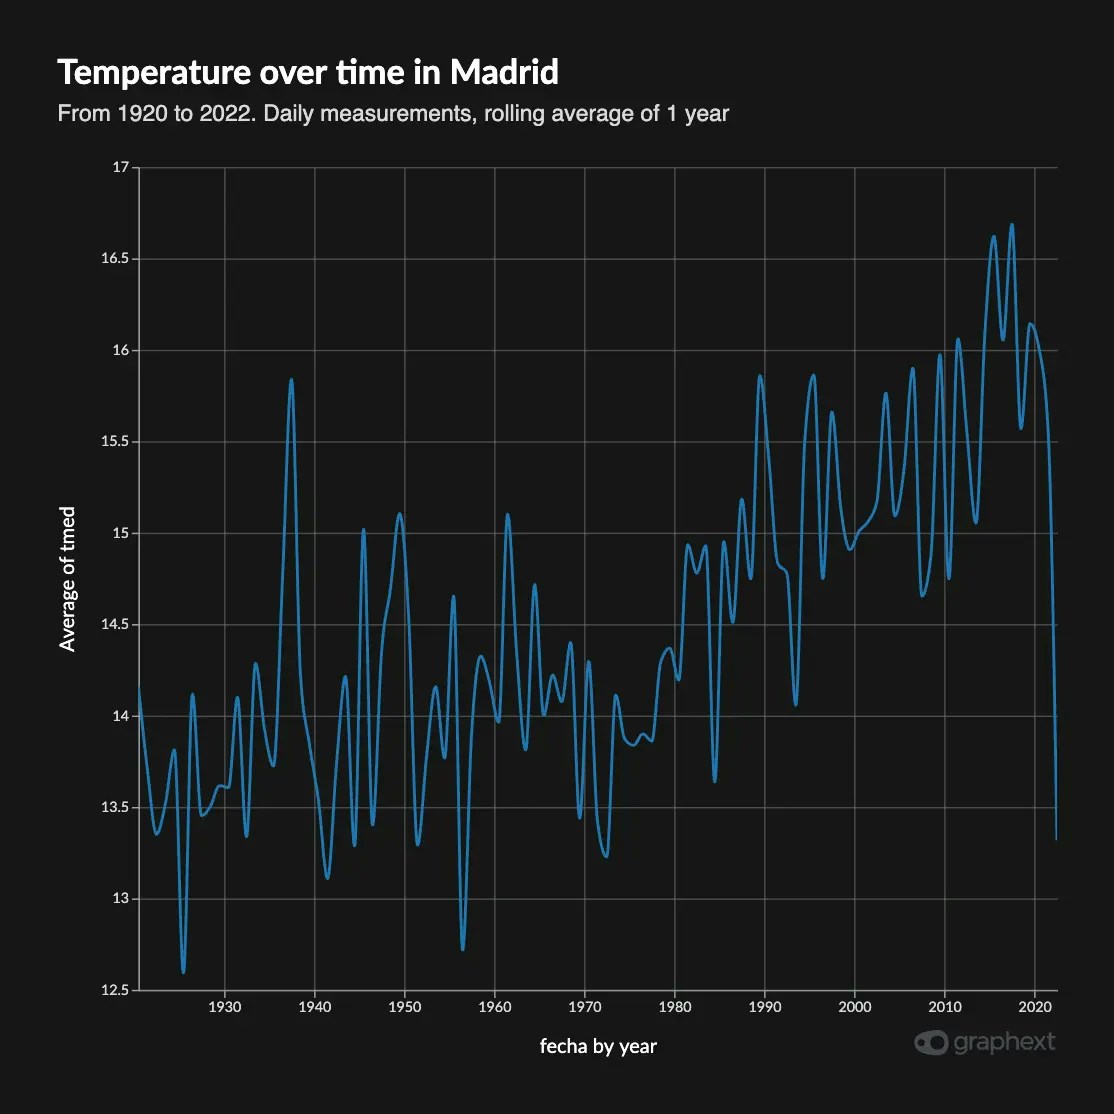
Themes are color and typography settings that change the look and feel of your chart. We currently include 7 themes inspired by the most used tools and their aesthetic decisions:- Graphext Dark
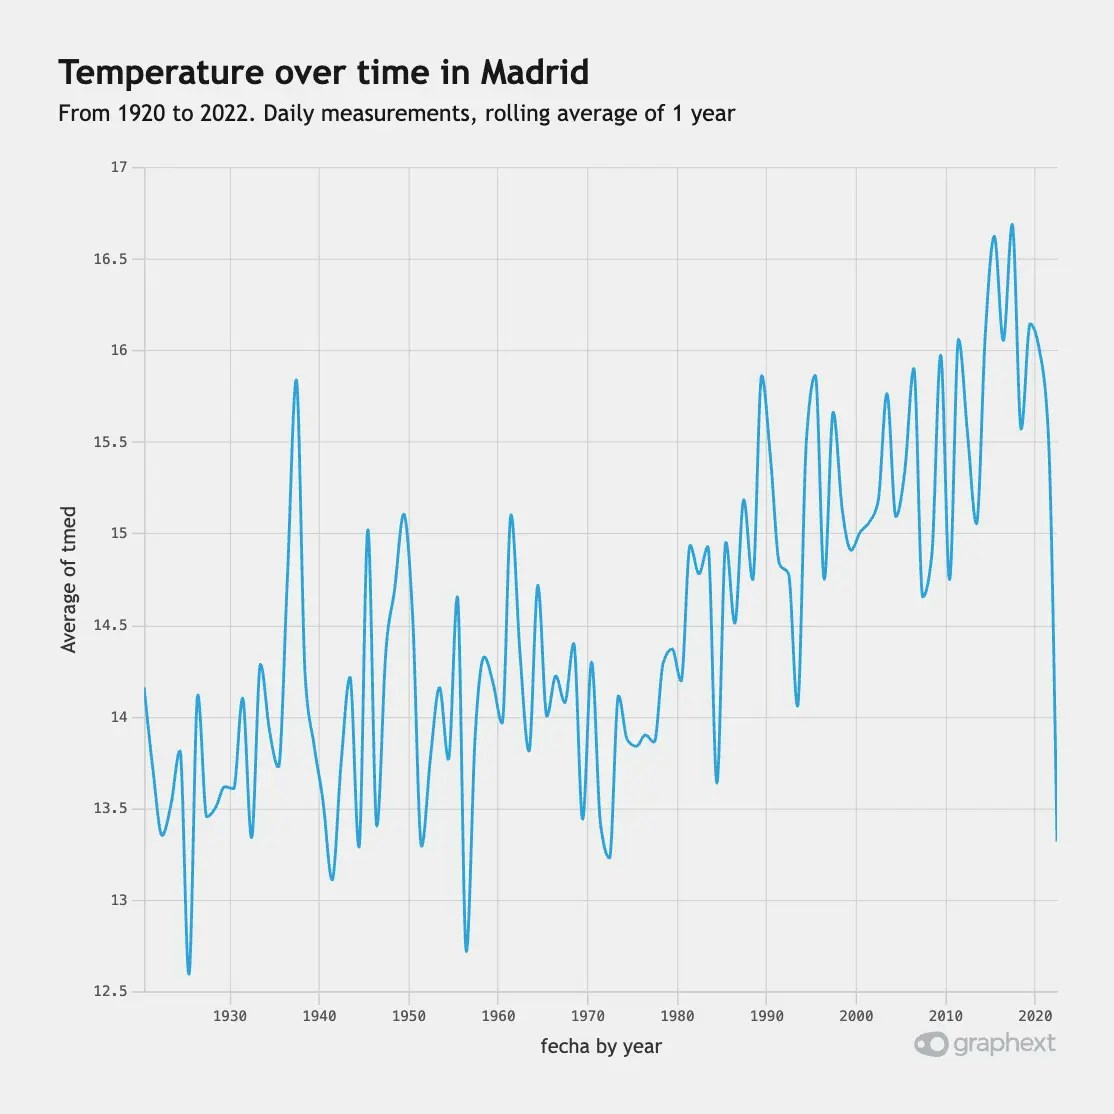
- Graphext Light
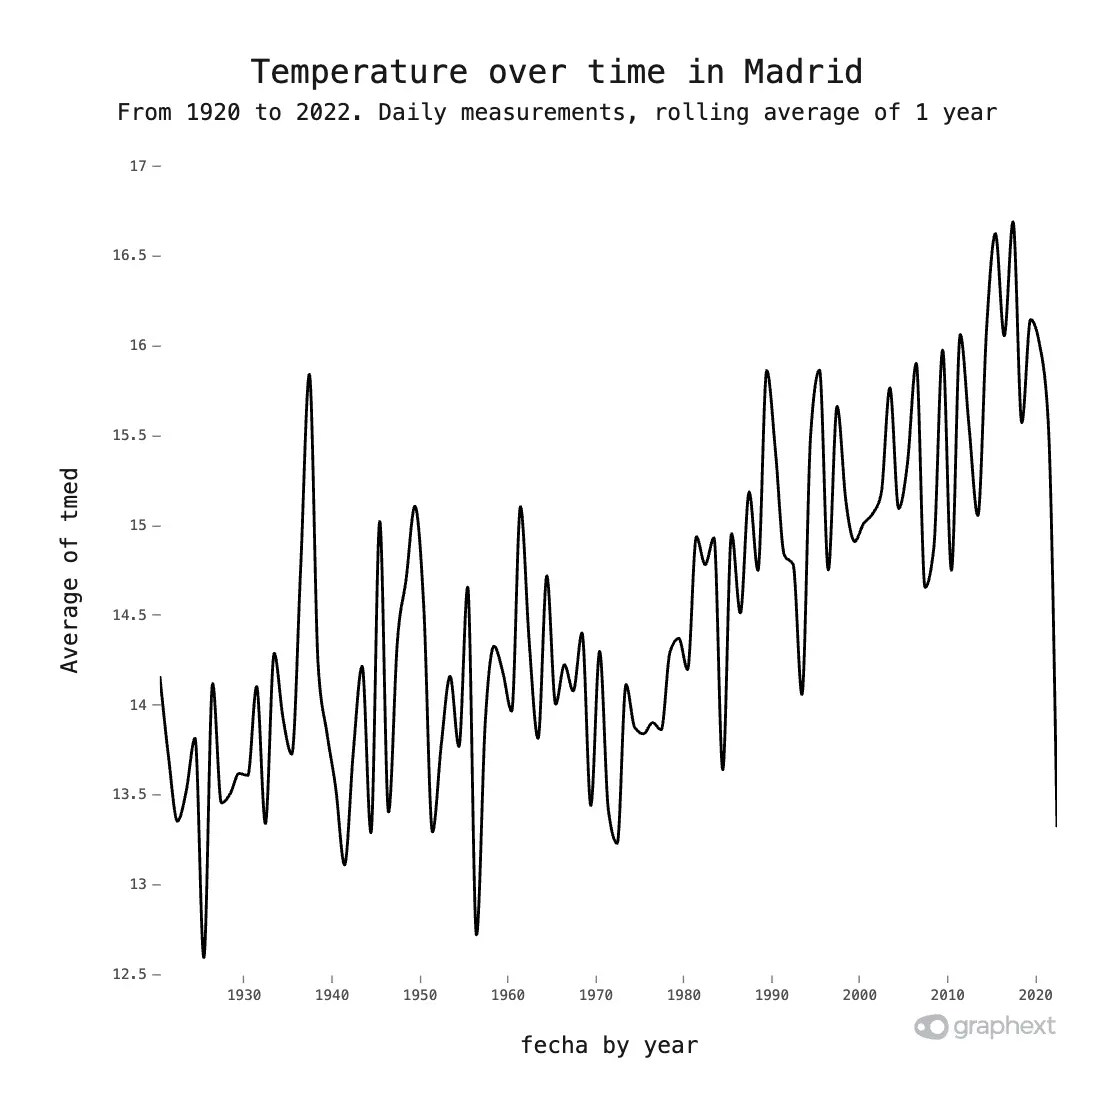
- FiveThirtyEight
- ggplot2
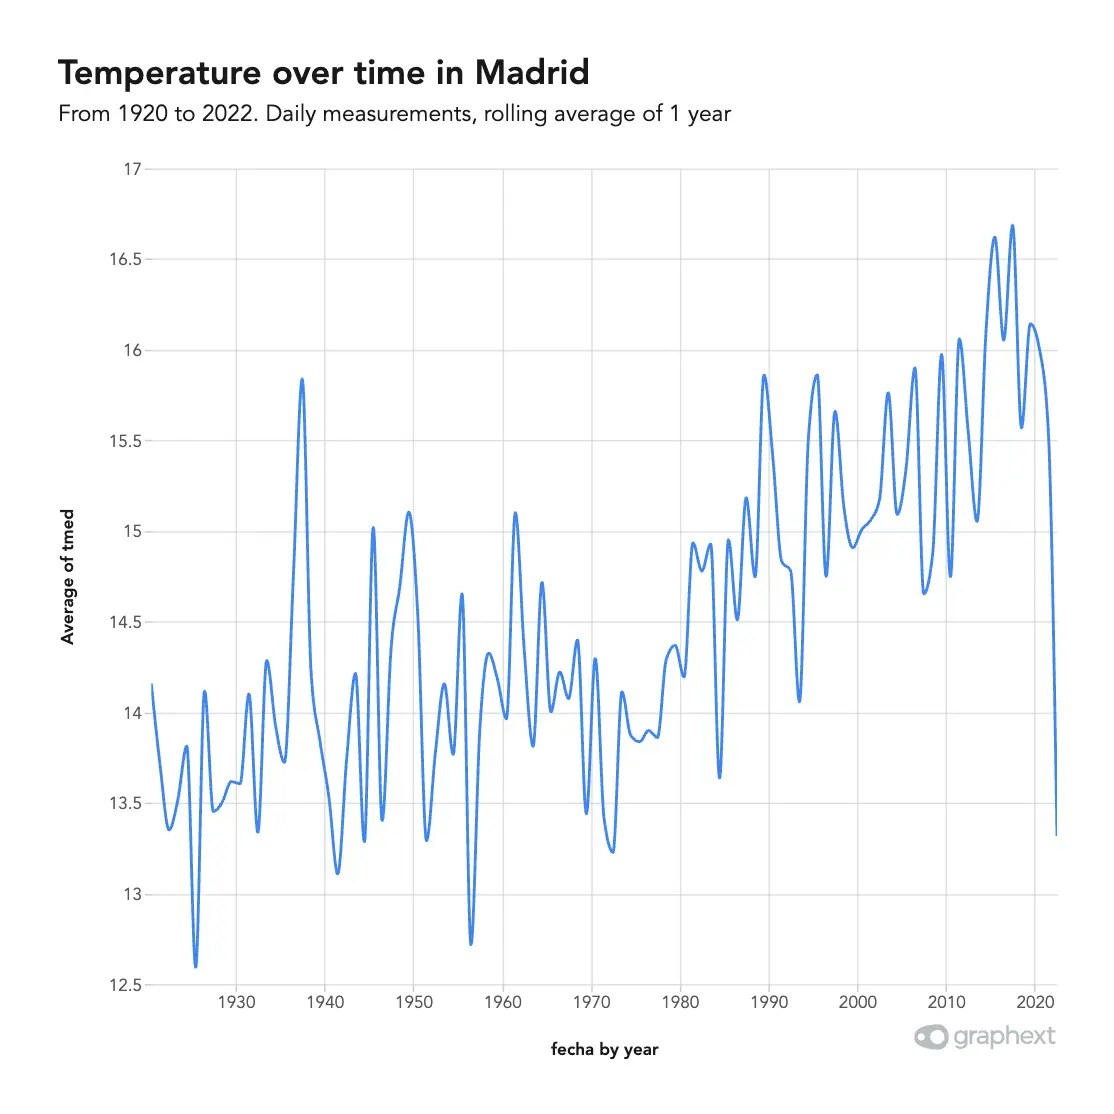
- Google Charts
- PowerBI
- Urban Institute

General Tab
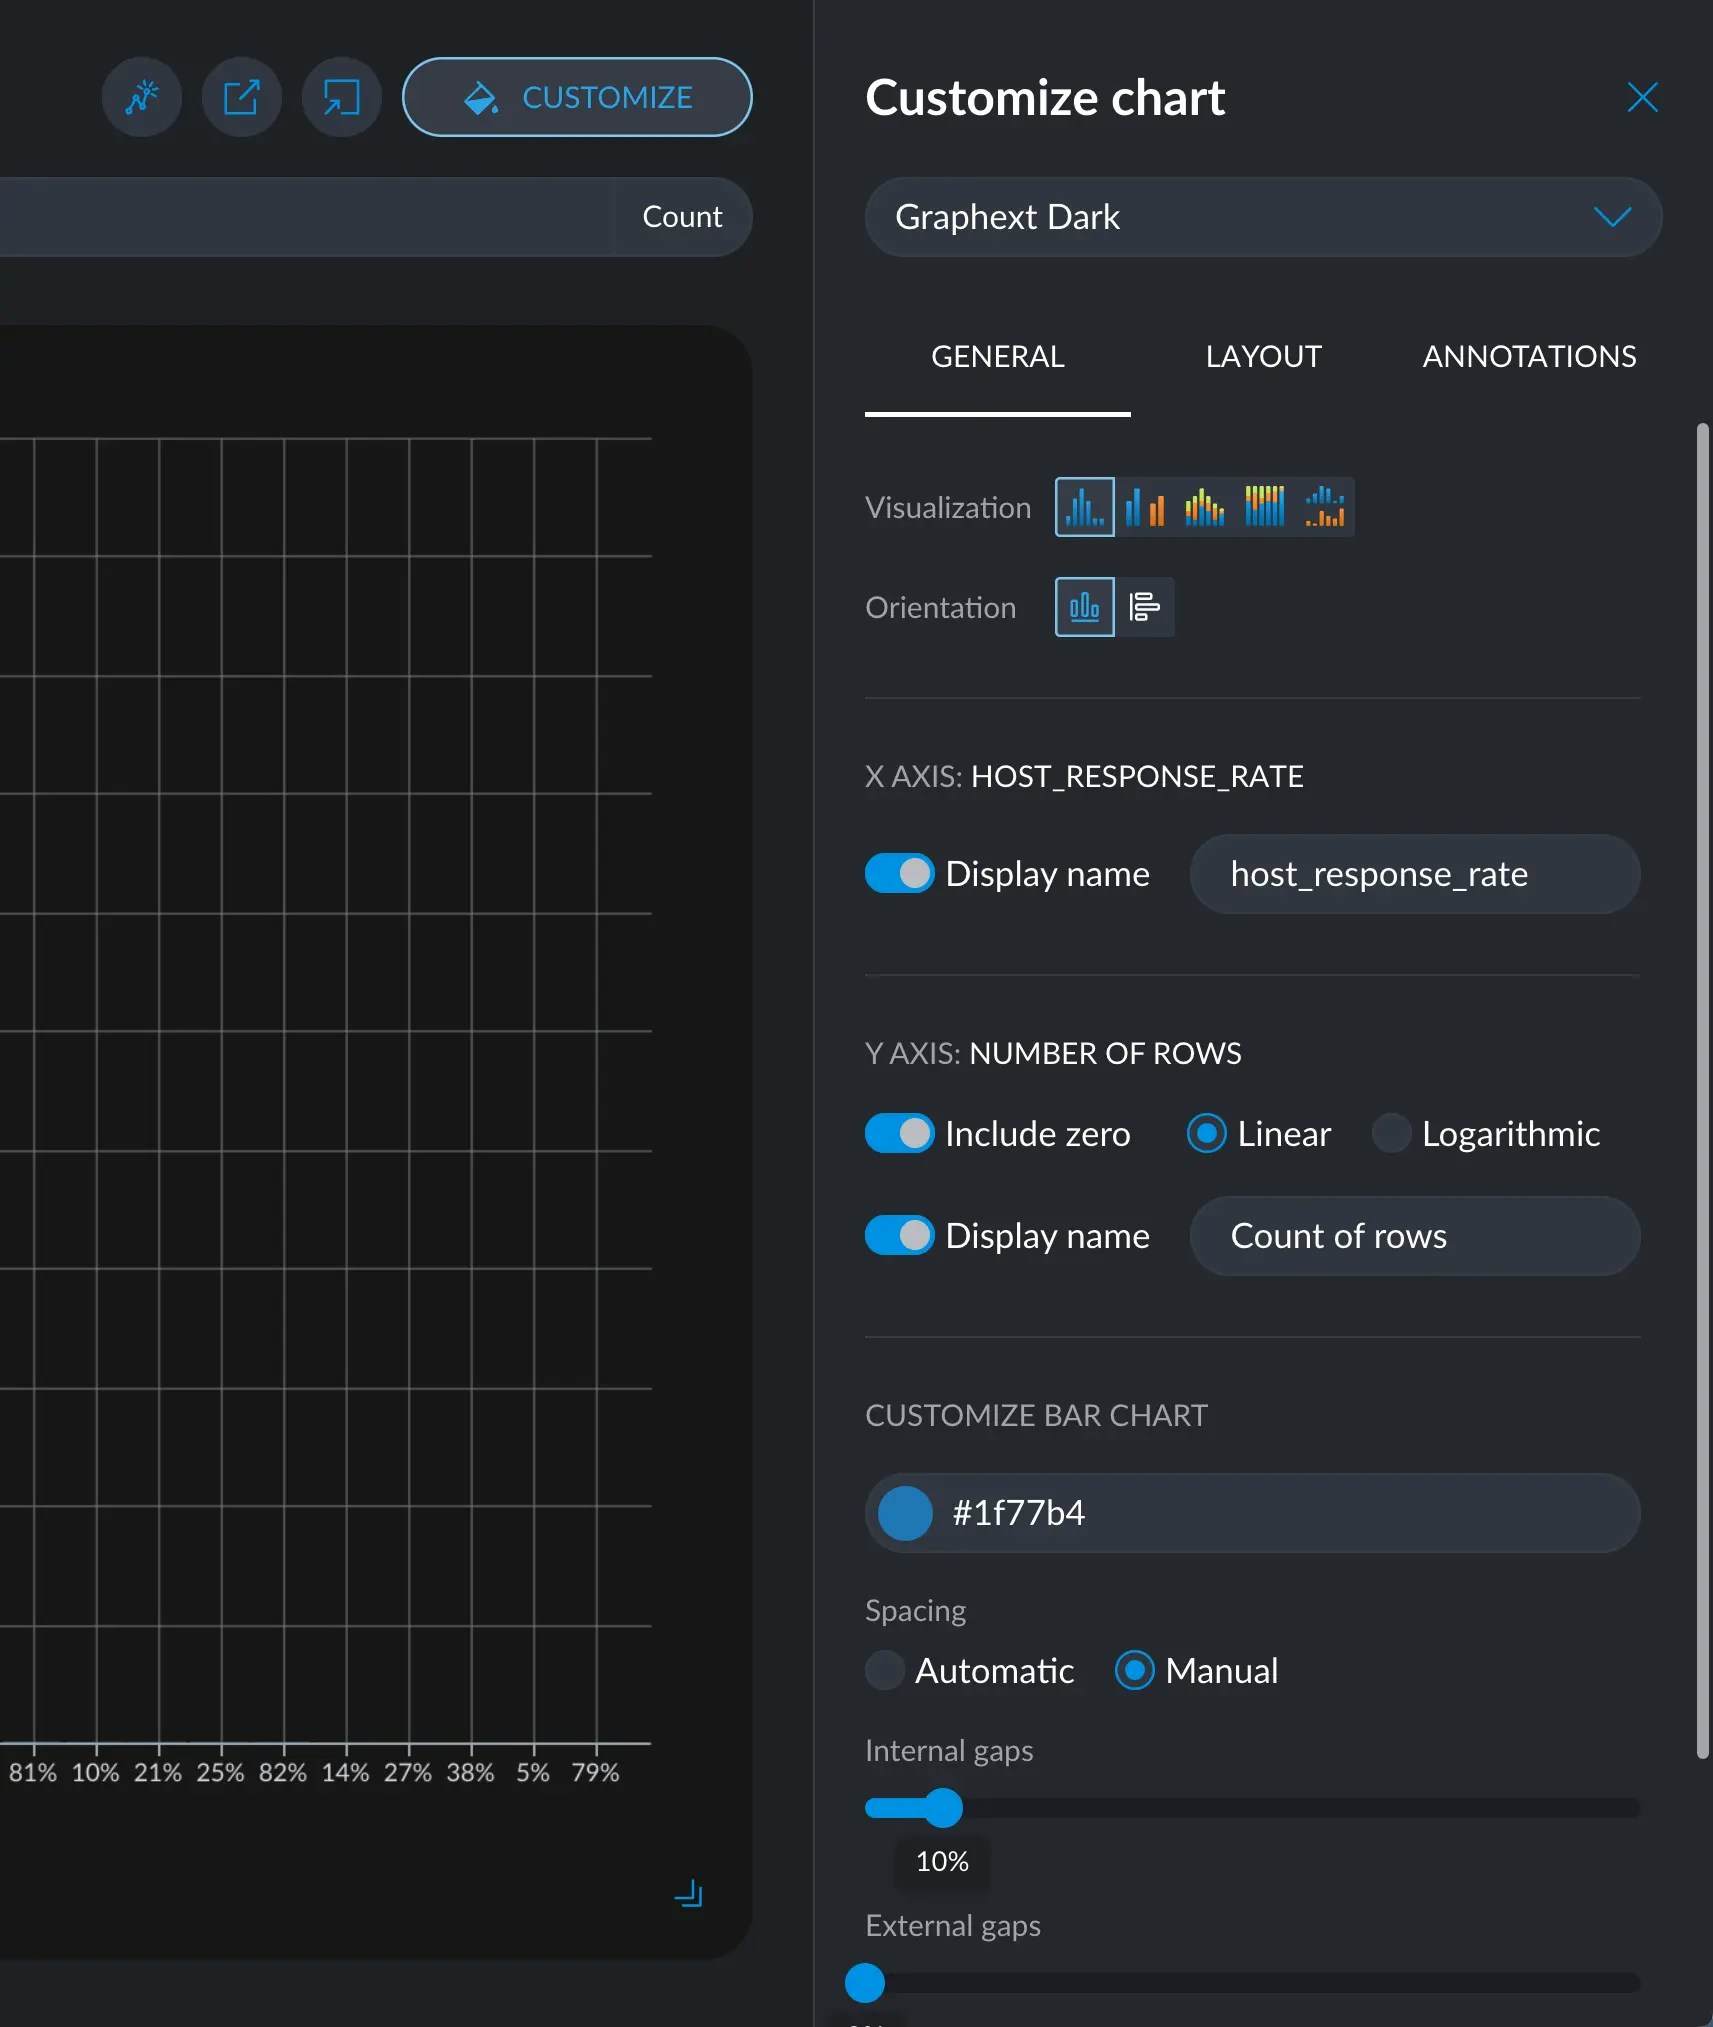
The General tab holds options for changing axis names, scales, customize color segments, spacings and such. On top of that, each plot will also display some exclusive options that may only make sense in that type of plot.Visualization & Orientation
These options are generally available in multi variable charts, like line, area, and bar charts. The Visualization option allows to include more variables to compare, taking you from a simple bar chart to a more rich grouped bar chart or stacked bar chart, for example. The Orientation option allows to swap the X and Y axes to make the chart horizontal or vertical. Horizontal charts are useful when the X axis has very long names in each tick.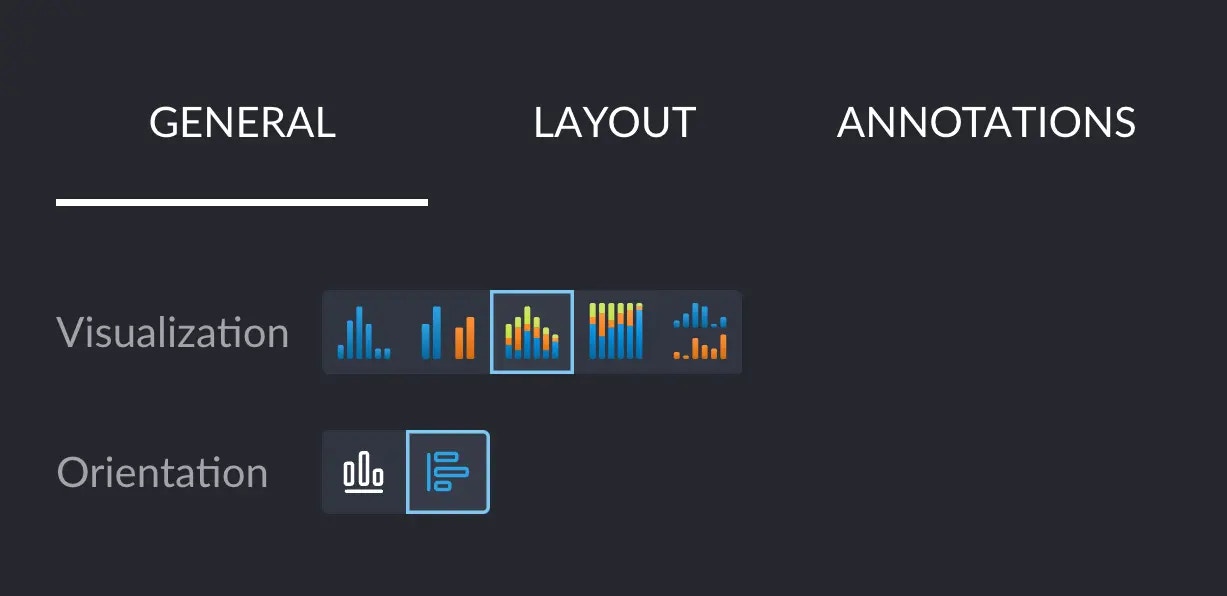
Axes Scale and Title
Axes customization of titles and scales are also generally available, where it applies. You can customize the Y scale, and titles for each axis. If available, the color display name will change the title above the legend for the colors.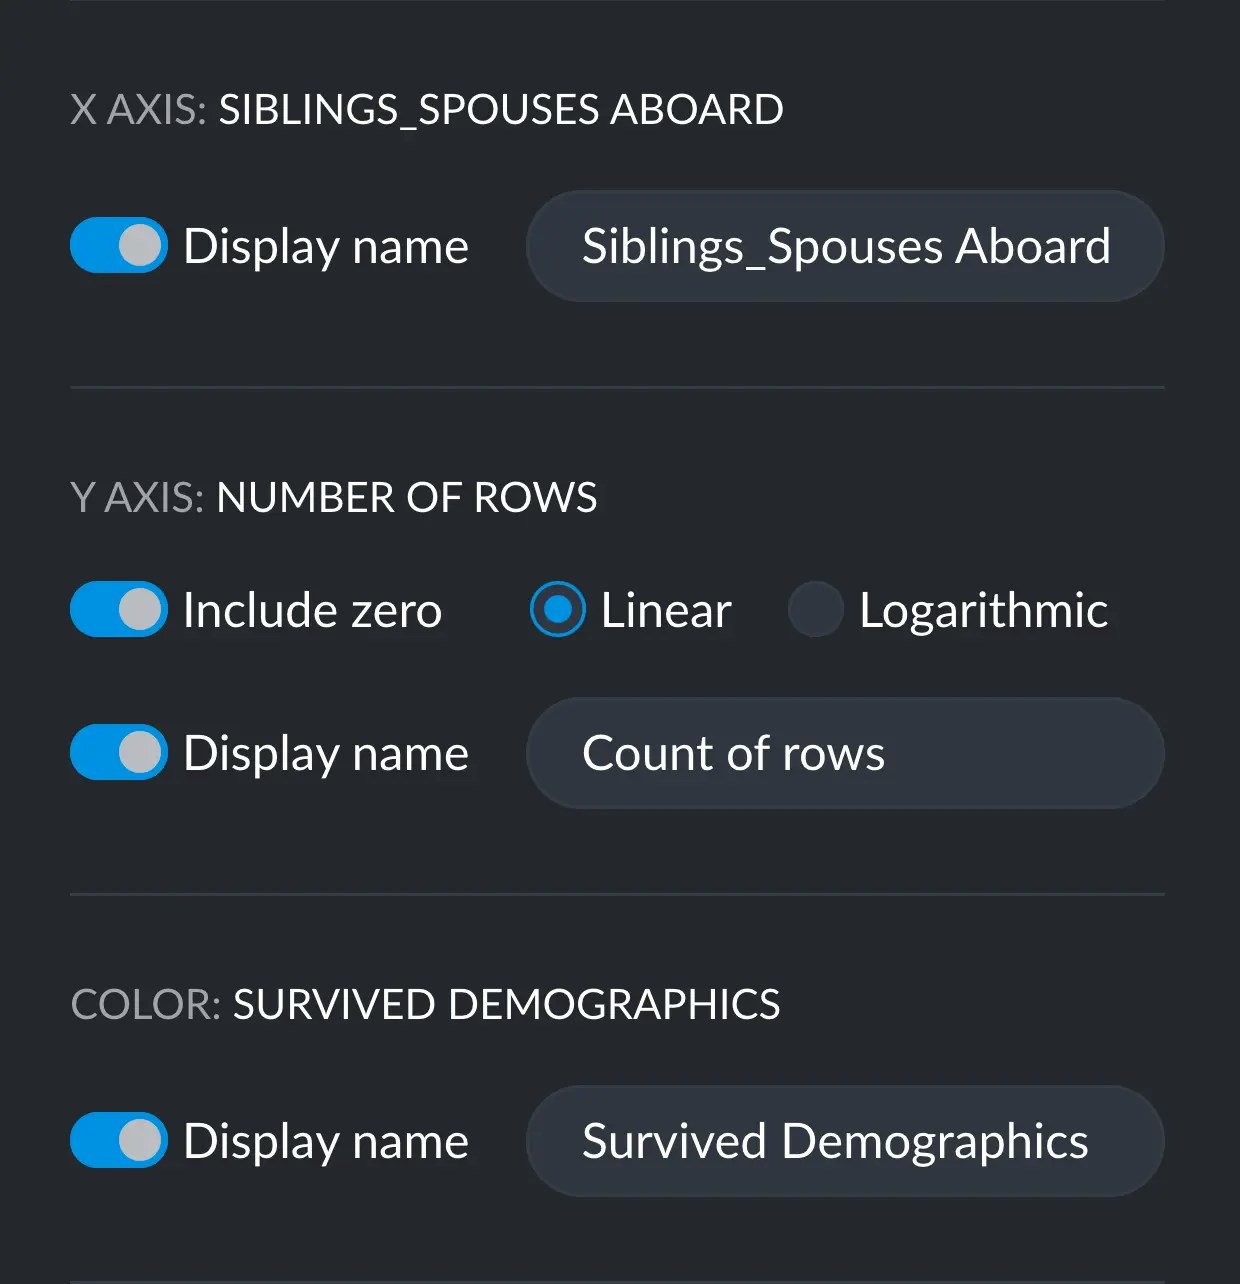
Colors
When available, you can customize the color of each segment and even change the order in which they appear.Layout tab
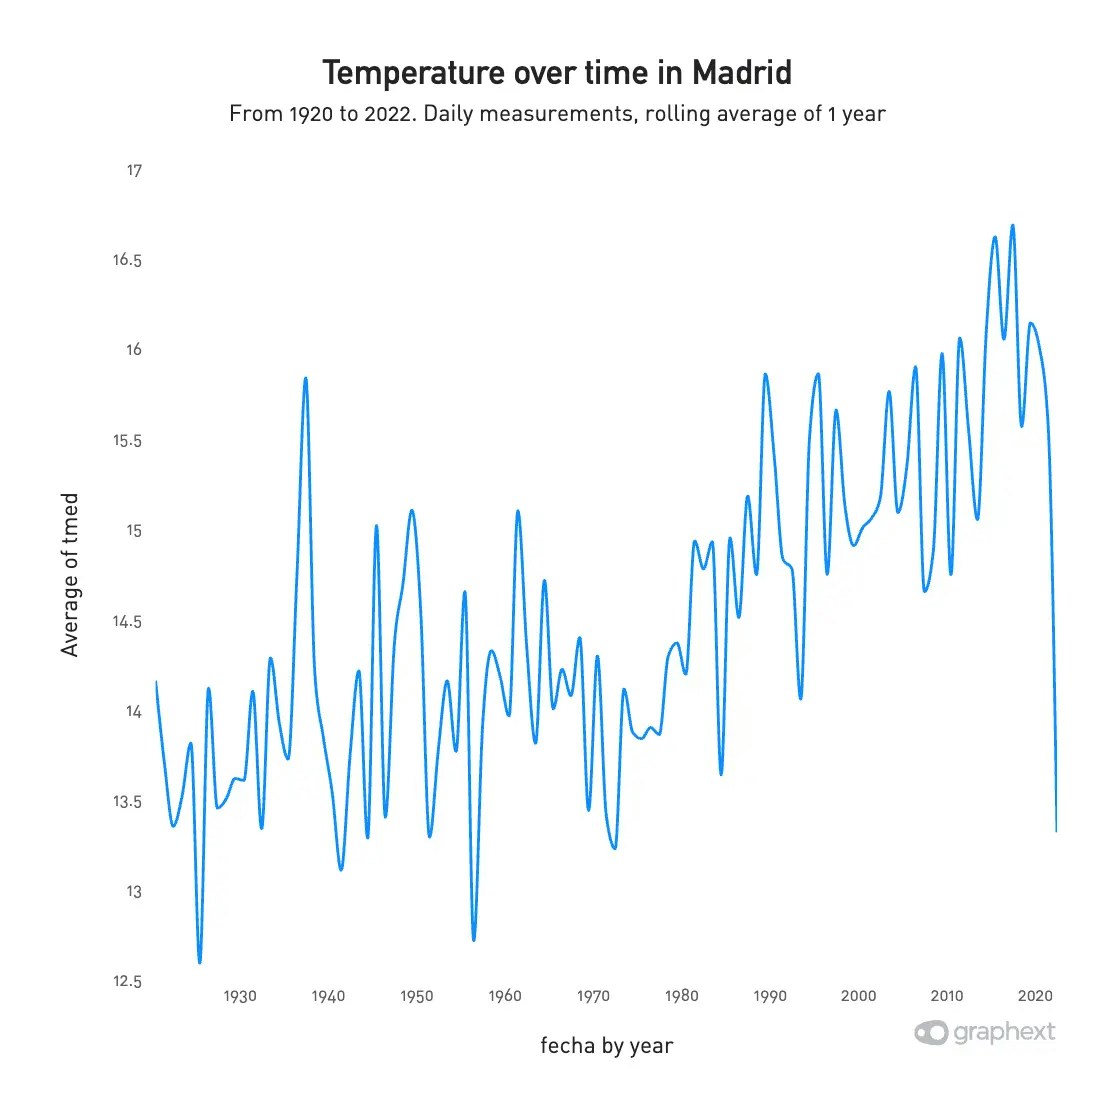
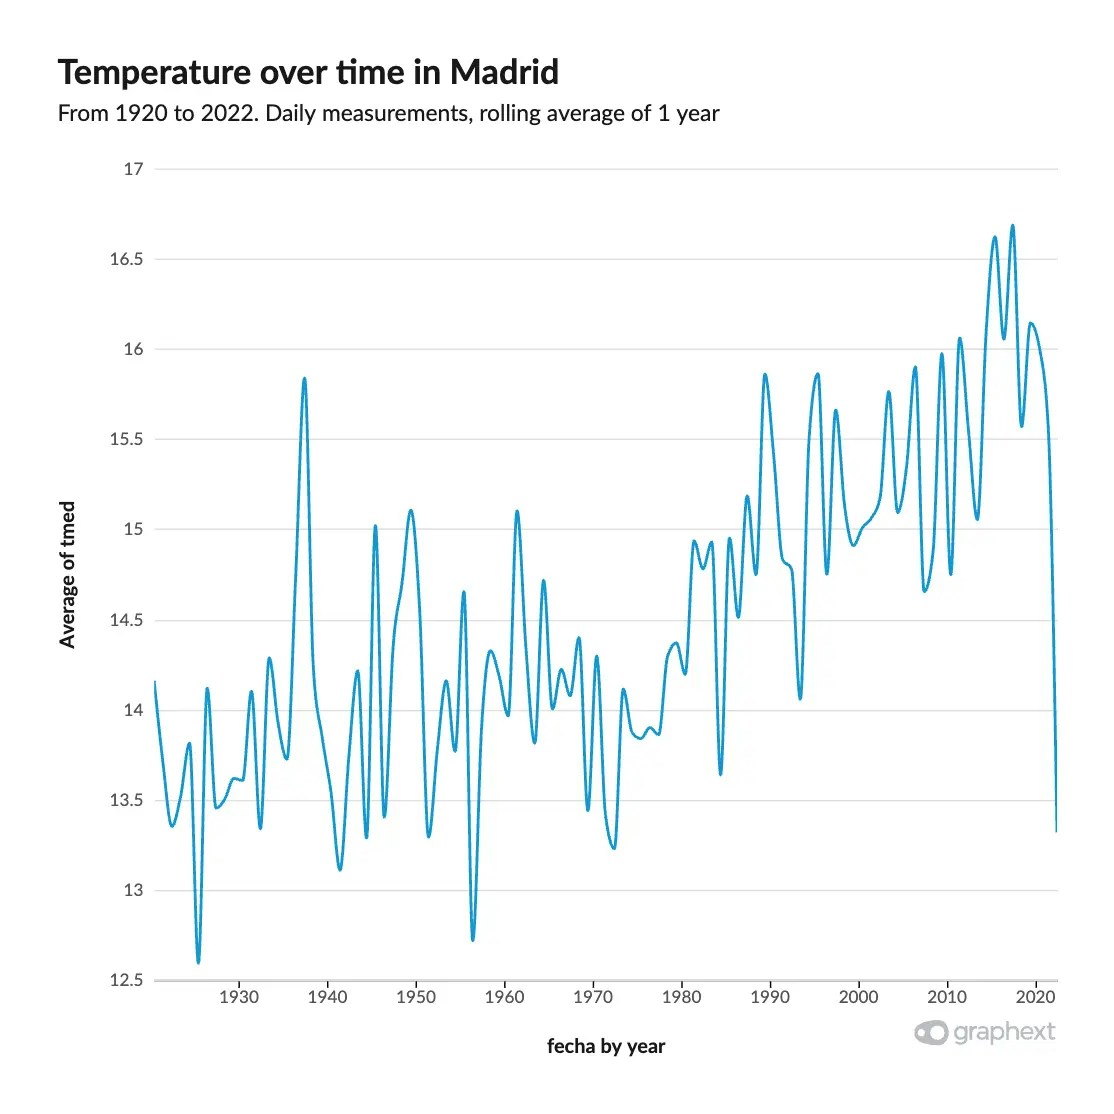
The Layout tab remains mostly the same in every chart type. Here you can change the size and proportions of the canvas the chart is over. You can also add a title, a subtitle, a description and a footer to your chart, essential when publishing anywhere.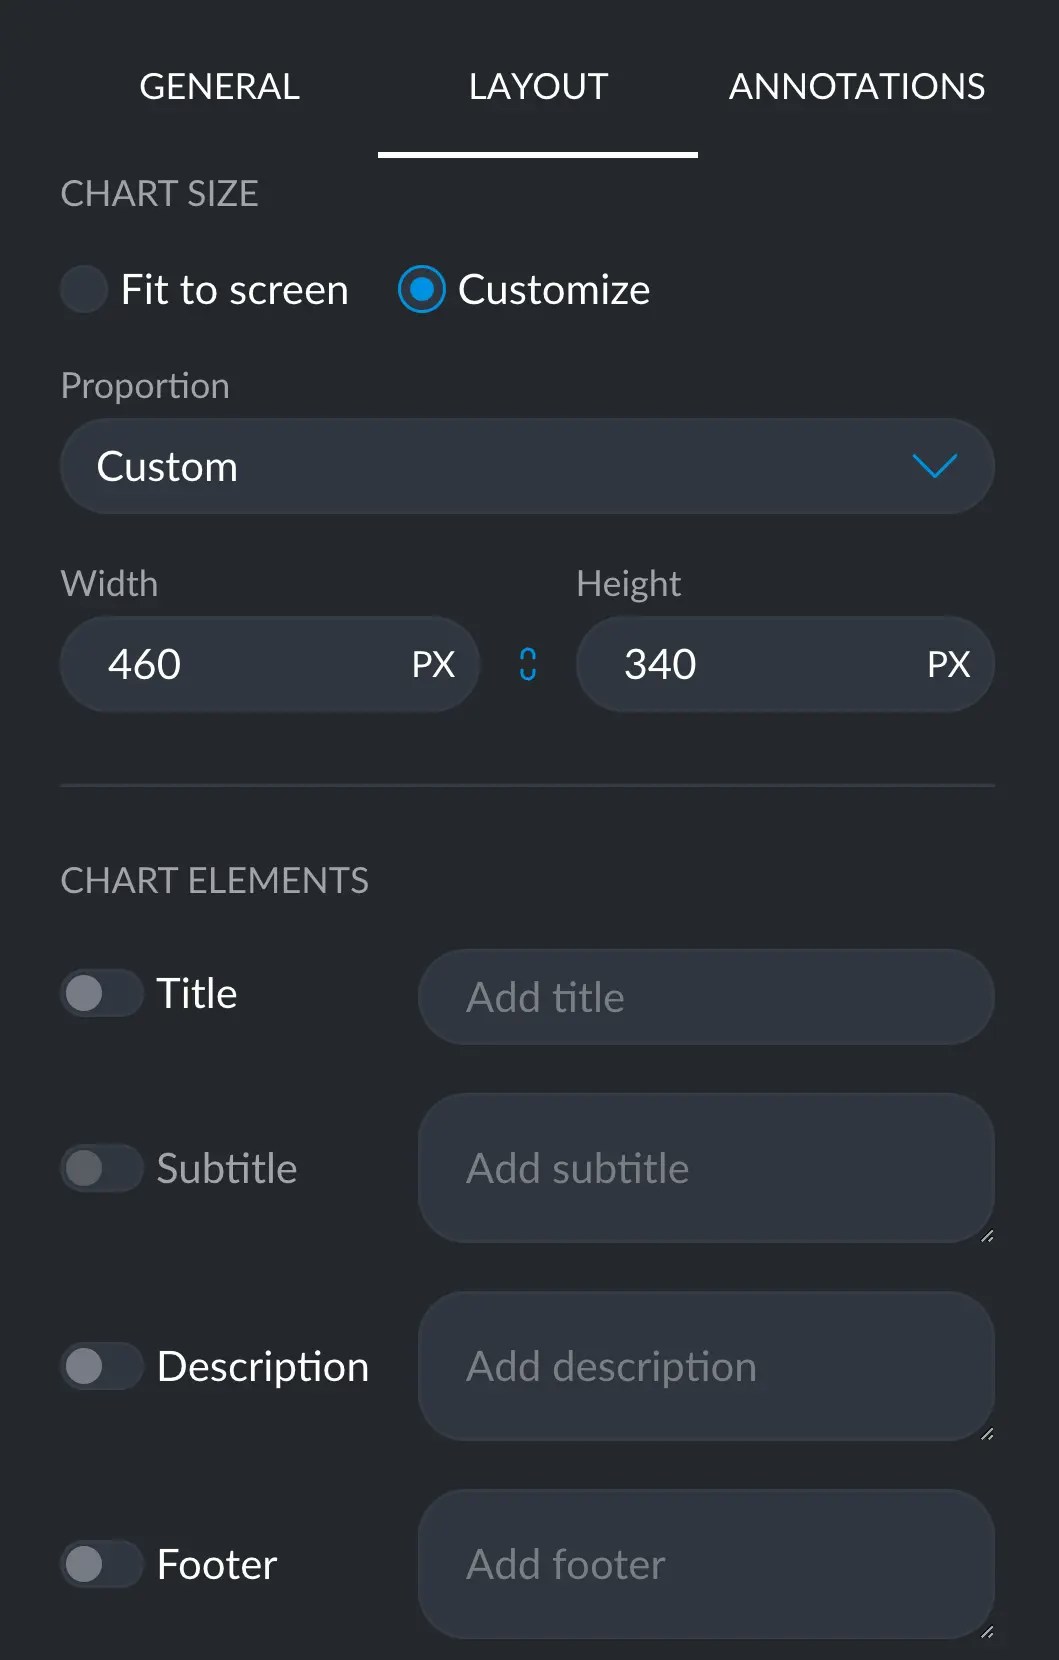
Annotations tab
The Annotations tab allows you to add little pieces of information, like value labels and statistic marks. This tab and the behavior of the marks will change depending on the orientation and nature of your chart.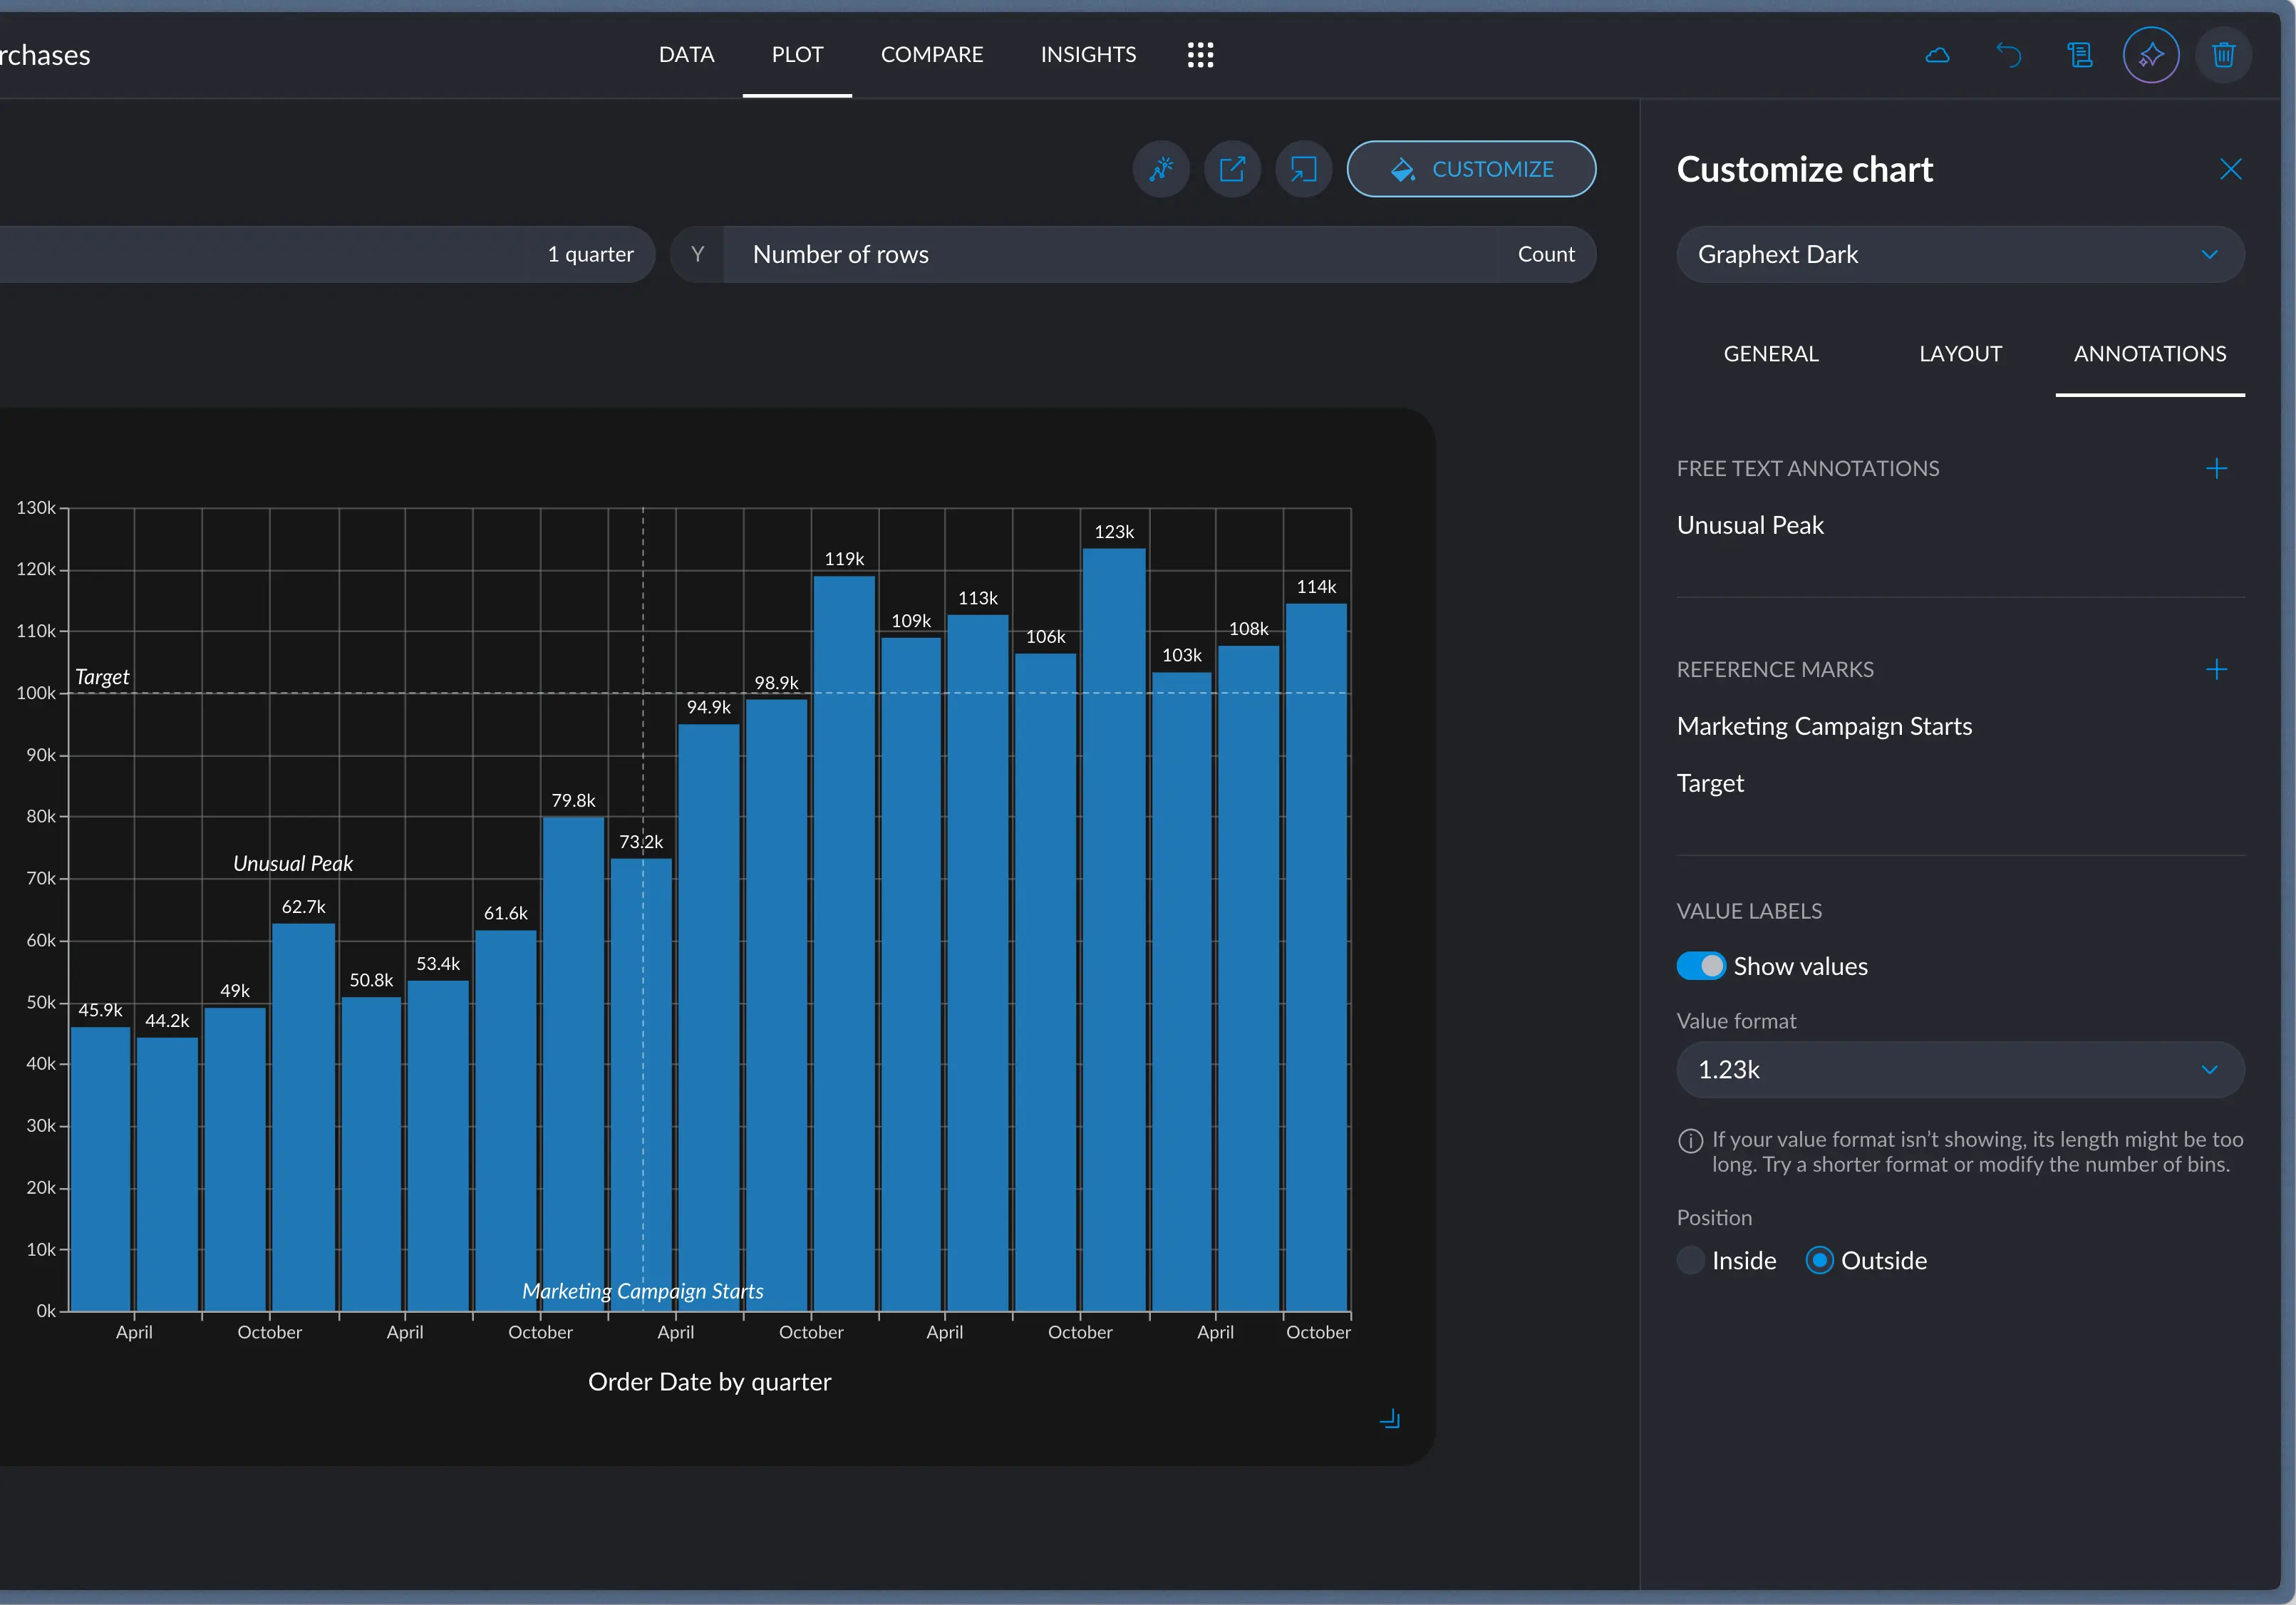
Free Text Annotations
Free text annotations allow you to position any given piece of text wherever you want. This makes it easy to emphasize some aspects of your chart that may be overlooked.Highlight shape
Additionally, you can add an arrow that may be attached to some text. This is very powerful to clarify something in your chart but just putting the text is not clear enough. When you add a new highlight shape, an arrow will appear in the middle of the chart. You can simply move the endpoints wherever you like. Write its corresponding text and move it where it best looks.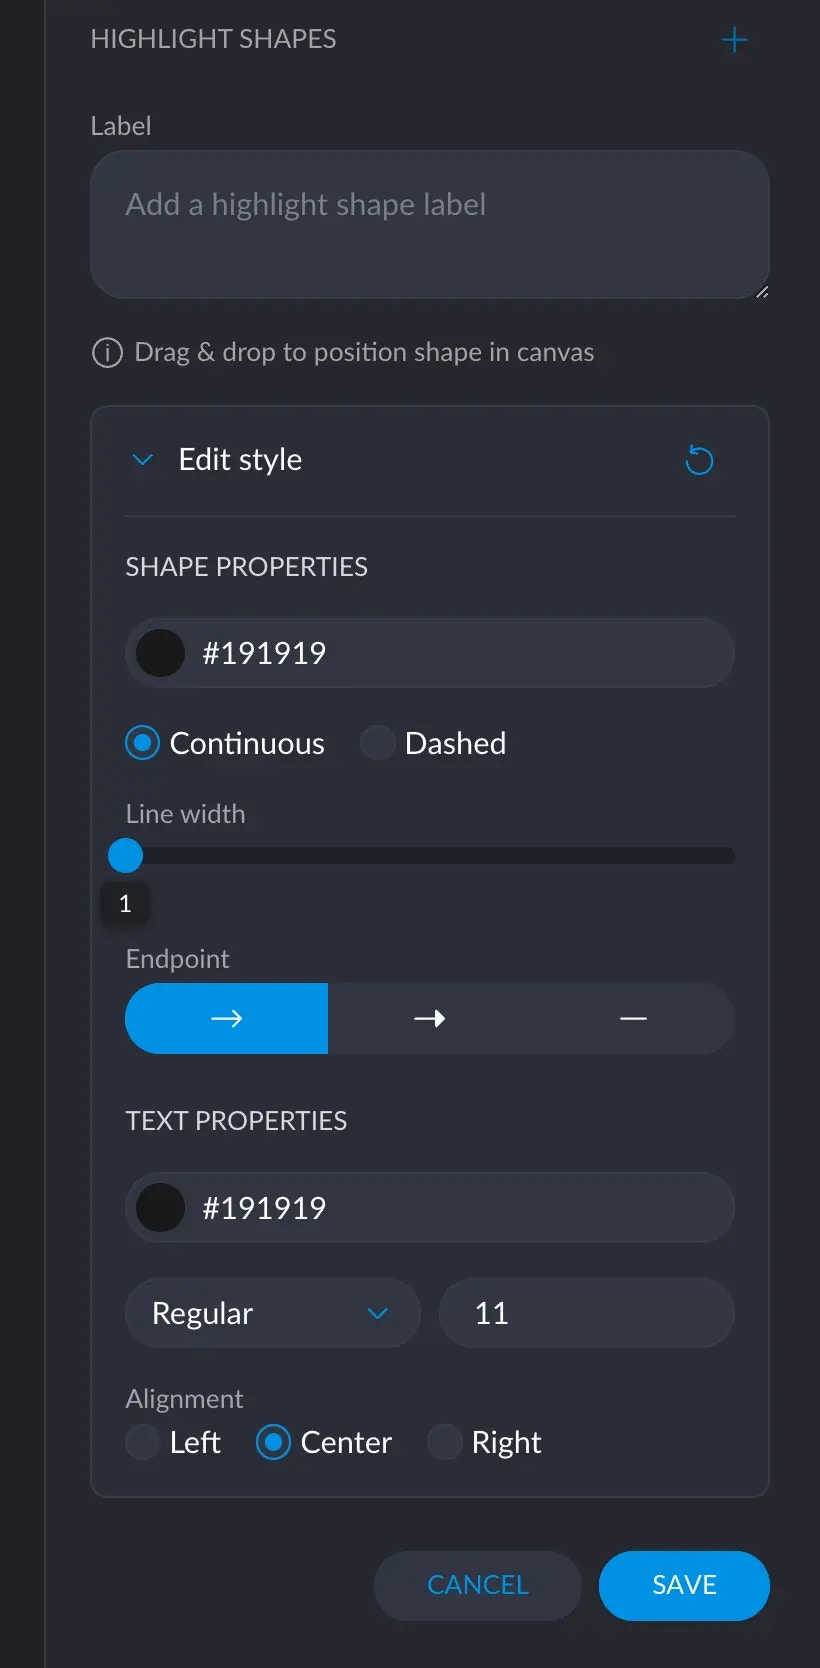
Reference Marks
Reference Marks are labels that have an associated value with respect to a given axis. To put one, click the + icon and select the axis in which you want to put your mark. Depending on its nature, you’ll be prompted to select a specific value to position it. You can also write a label that offers more information around that value.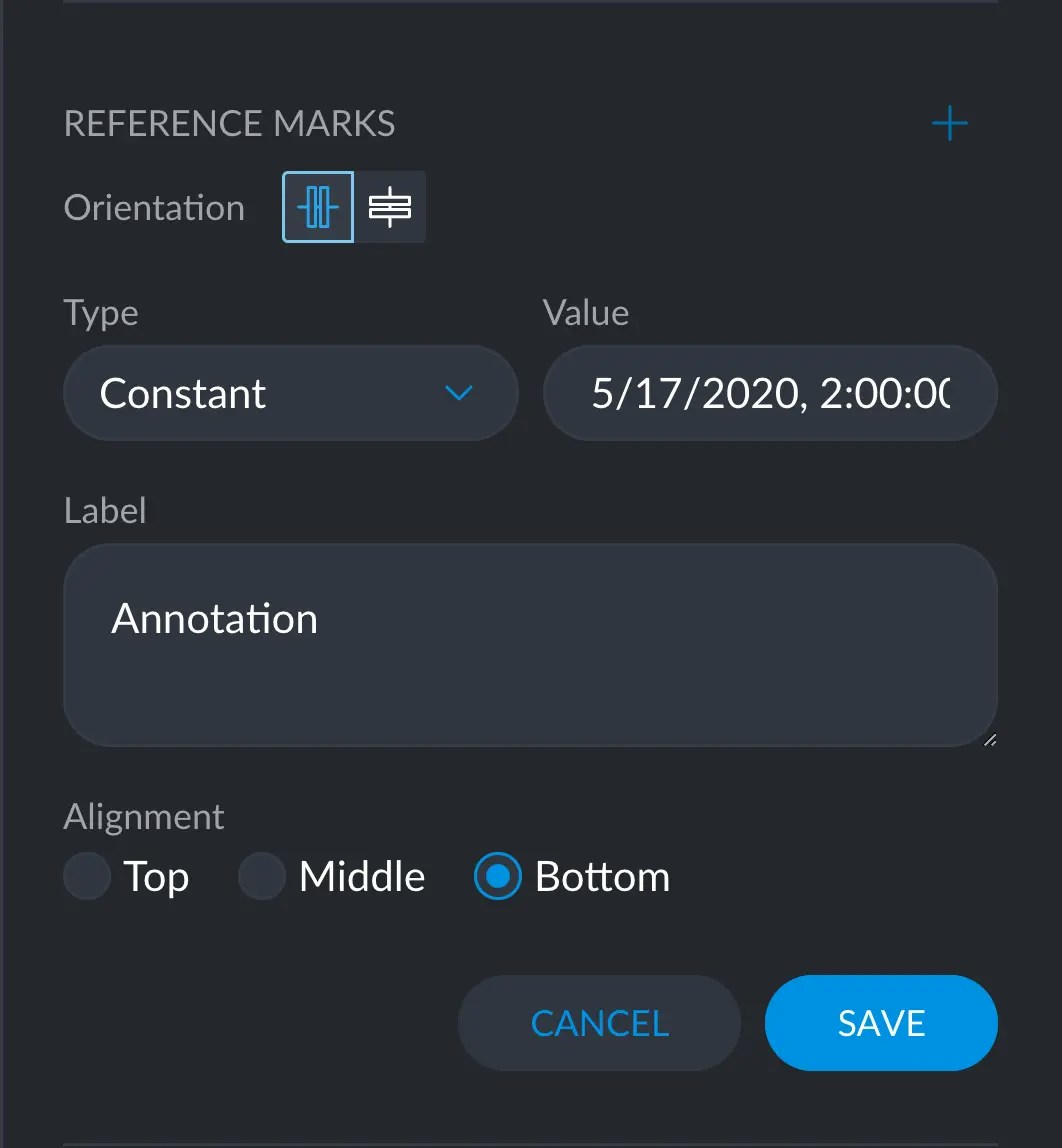
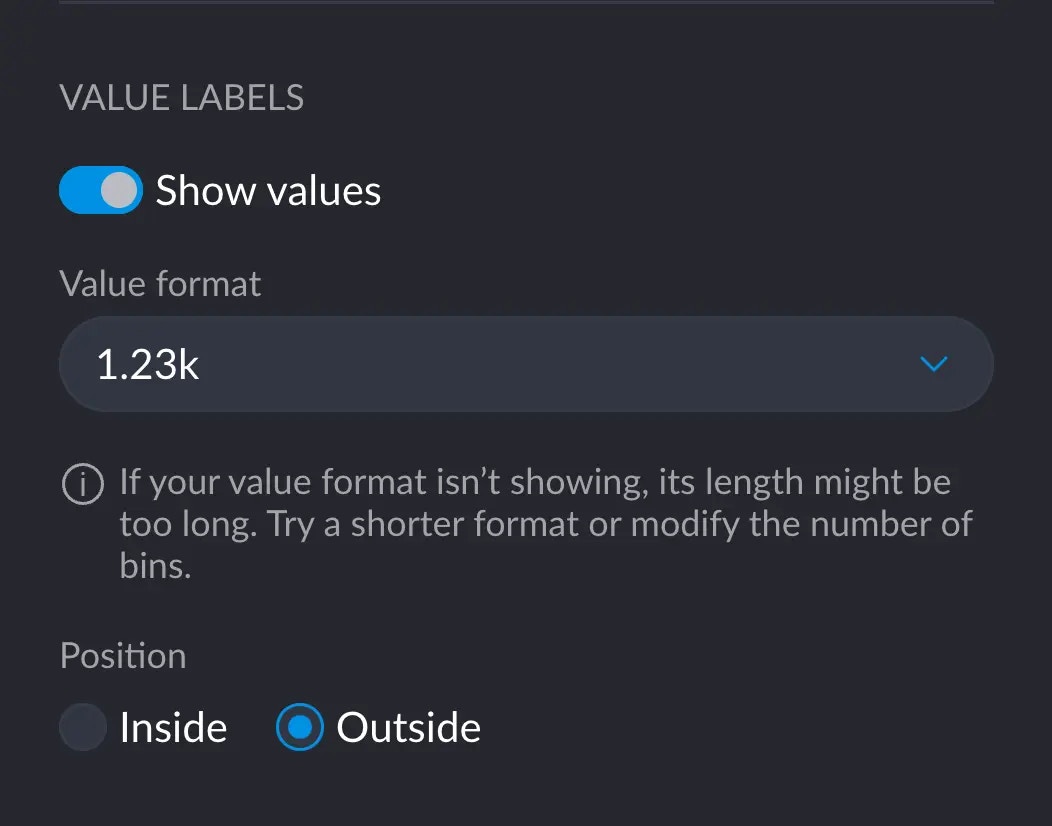
Show Values
Shows the value for each element in your chart, making comparisons that much easier and convenient. You can change the formatting and positioning.