Absolute and Relative percentages
Upon filtering, all the other variables react to the filter. They show the relative percentage of entries that fall into their respective categories, effectively showing you a real-time distribution of the selected data, but in every other column. To bring it home, let’s see this example.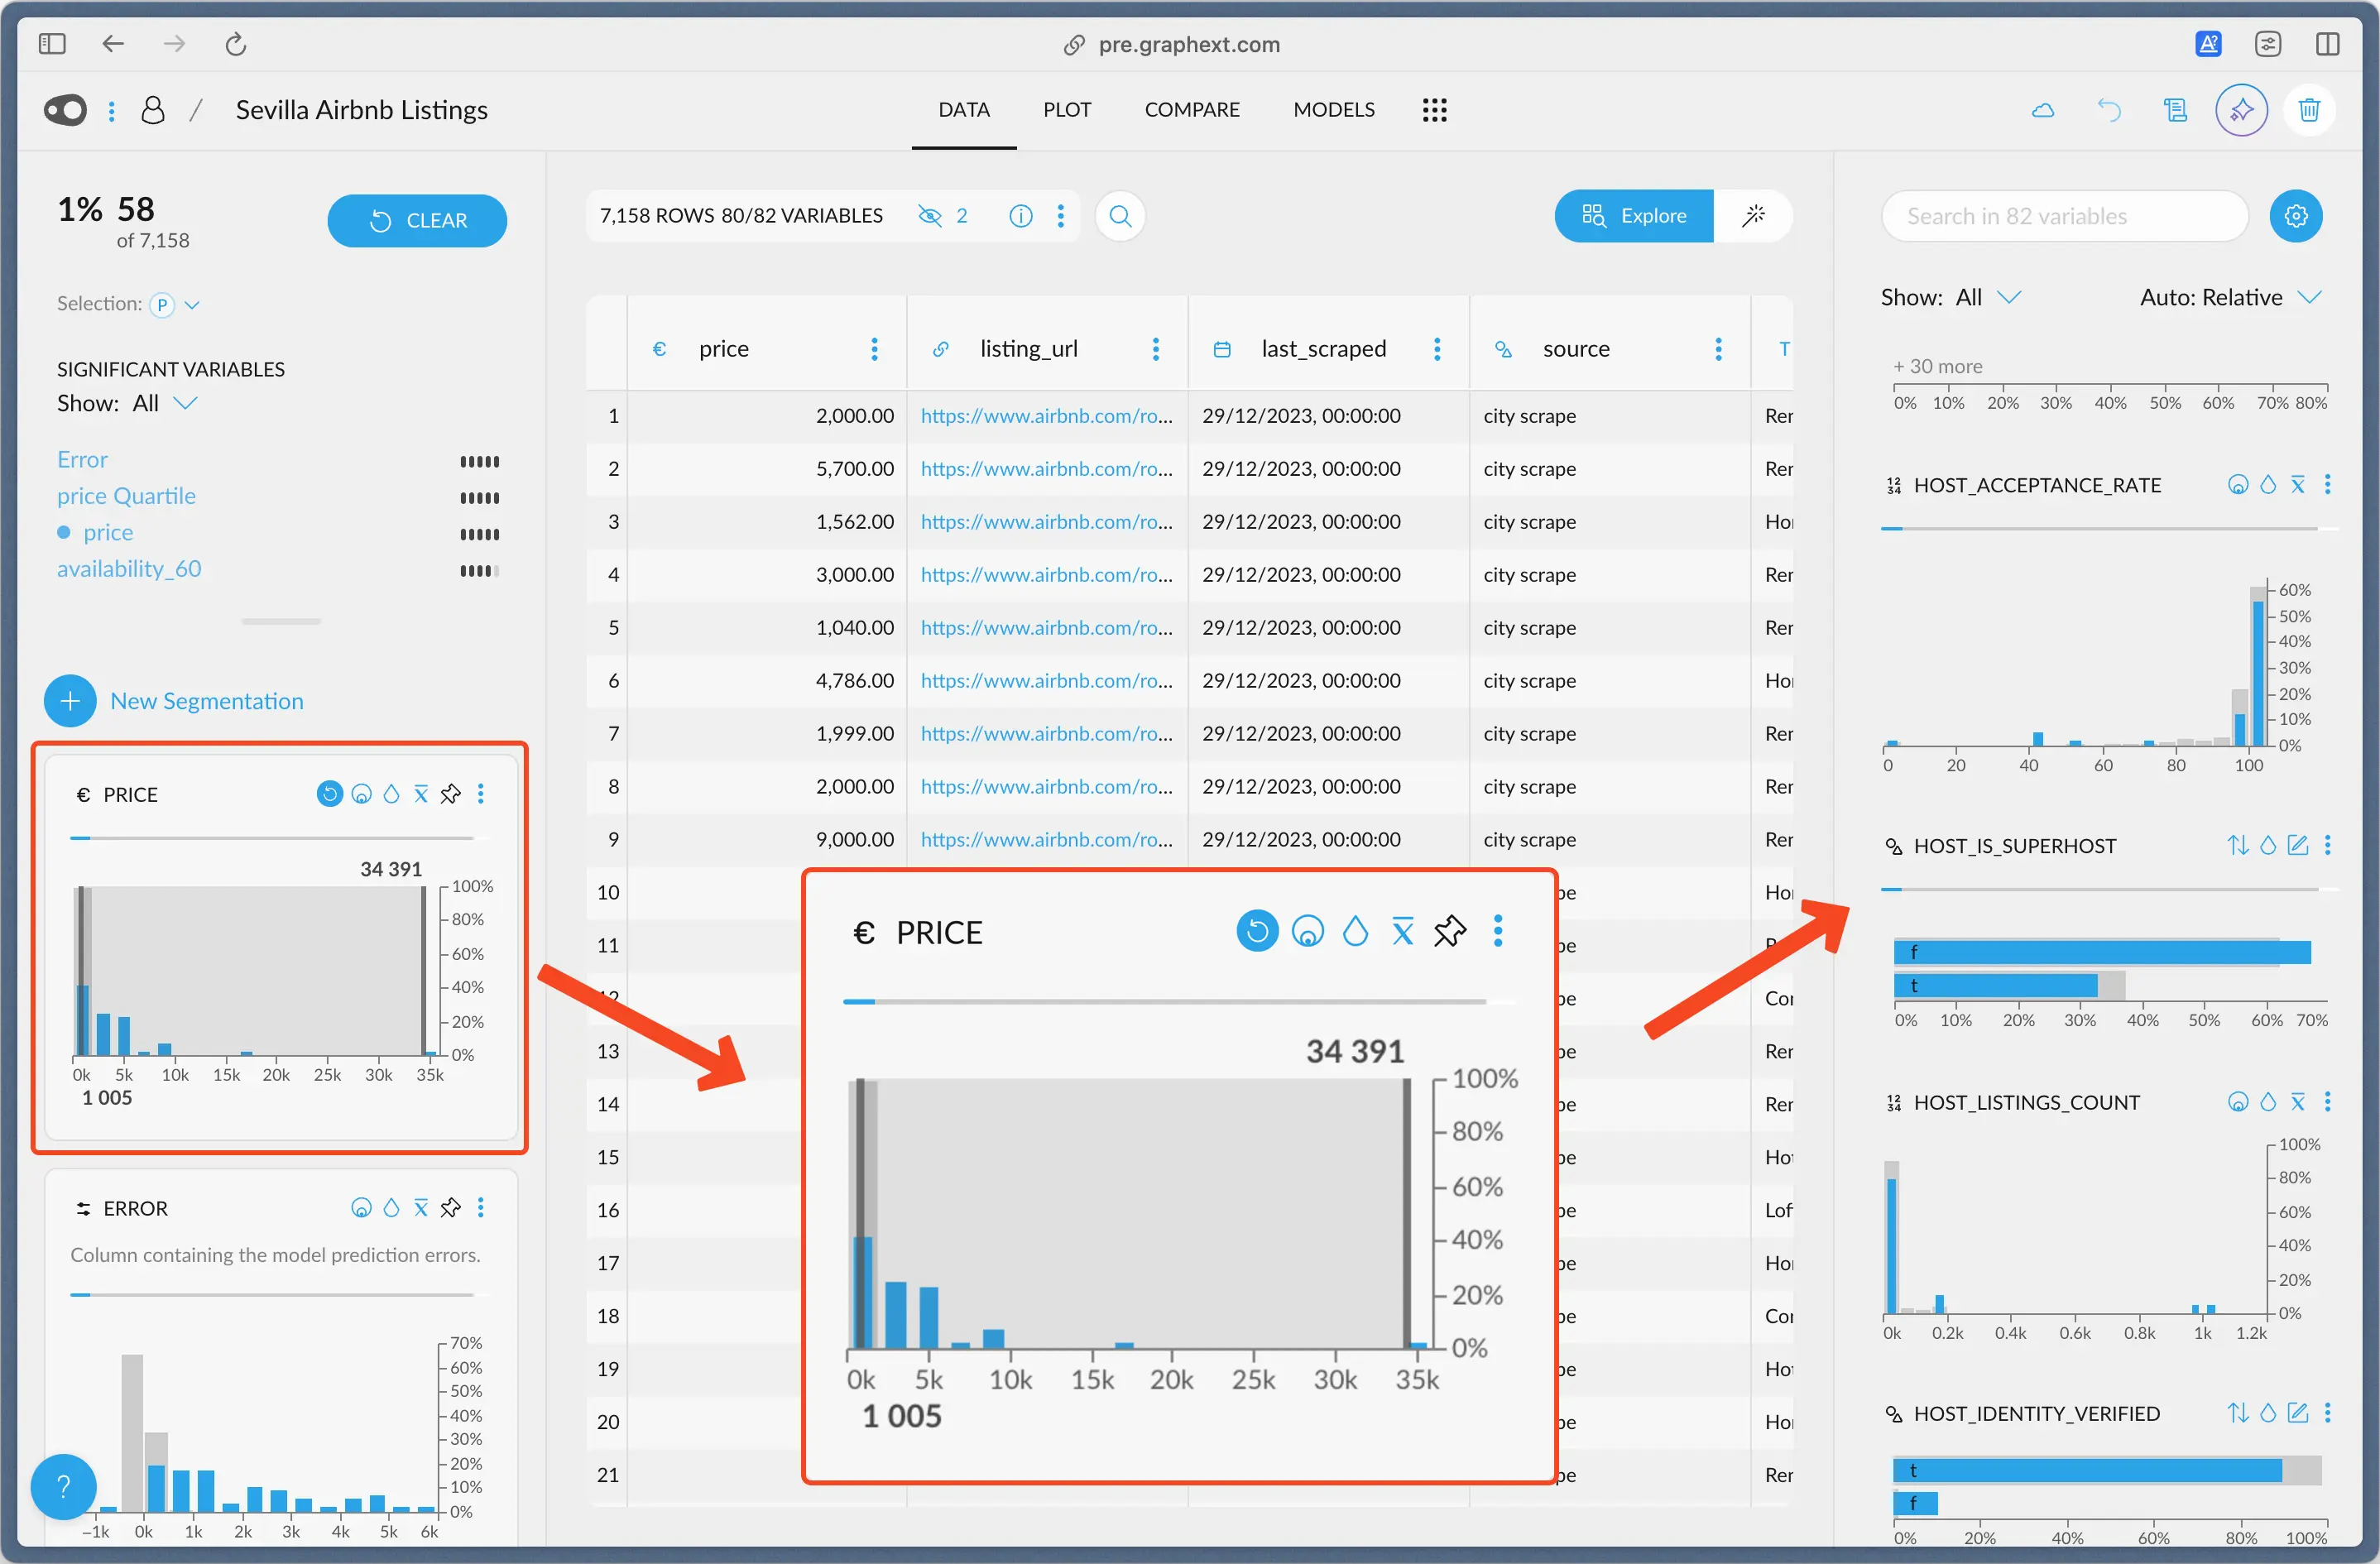
Example: Host Acceptance Rate
Upon filtering the price, we see the histogram forhost_acceptance_rate changed.
Now, it shows a percentage y-scale. The gray bars that sit in the background
correspond to the percentage of entries that lie in that bin, had we NOT filtered the data.
We can see that the last bar, which corresponds to an acceptance rate range from 100
to 110, goes to just over 60%. That means that over 60% of all the hosts have an
acceptance rate of 100 or more.
The blue bar on top indicates the percentage of entries that lie in that bin,
out of the current selection. Around 55% of the 58 rows we have selected
lie in that acceptance rate range. That’s around ~31 rows.
Example: Is Super Host
Another example is theis_super_host variable, just under it. This variable is
either true (t) or false (f) indicating if the host is marked as a Super Host.
In the whole dataset, around 63% of the hosts are not Super Hosts (f). However,
in our particular selection, this is accentuated. Around 70% of the entries we have
selected are not Super Hosts. This can be of relevance, depending the questions
we are asking.
The opposite also applies: the percentage of hosts in our selection is
less than the percentage of hosts in the entire dataset.