In the same way you can customize the looks on your chart, you can also customize its different axes.
These are not aesthetic changes, though, as one can tell completely different stories by changing these settings.
Axes configuration
Depending on the nature of the variable used for a given axis and the type of chart you are working
with, some options will come up to help you shape the data and resulting visualization.
Let’s review some of the common ones:
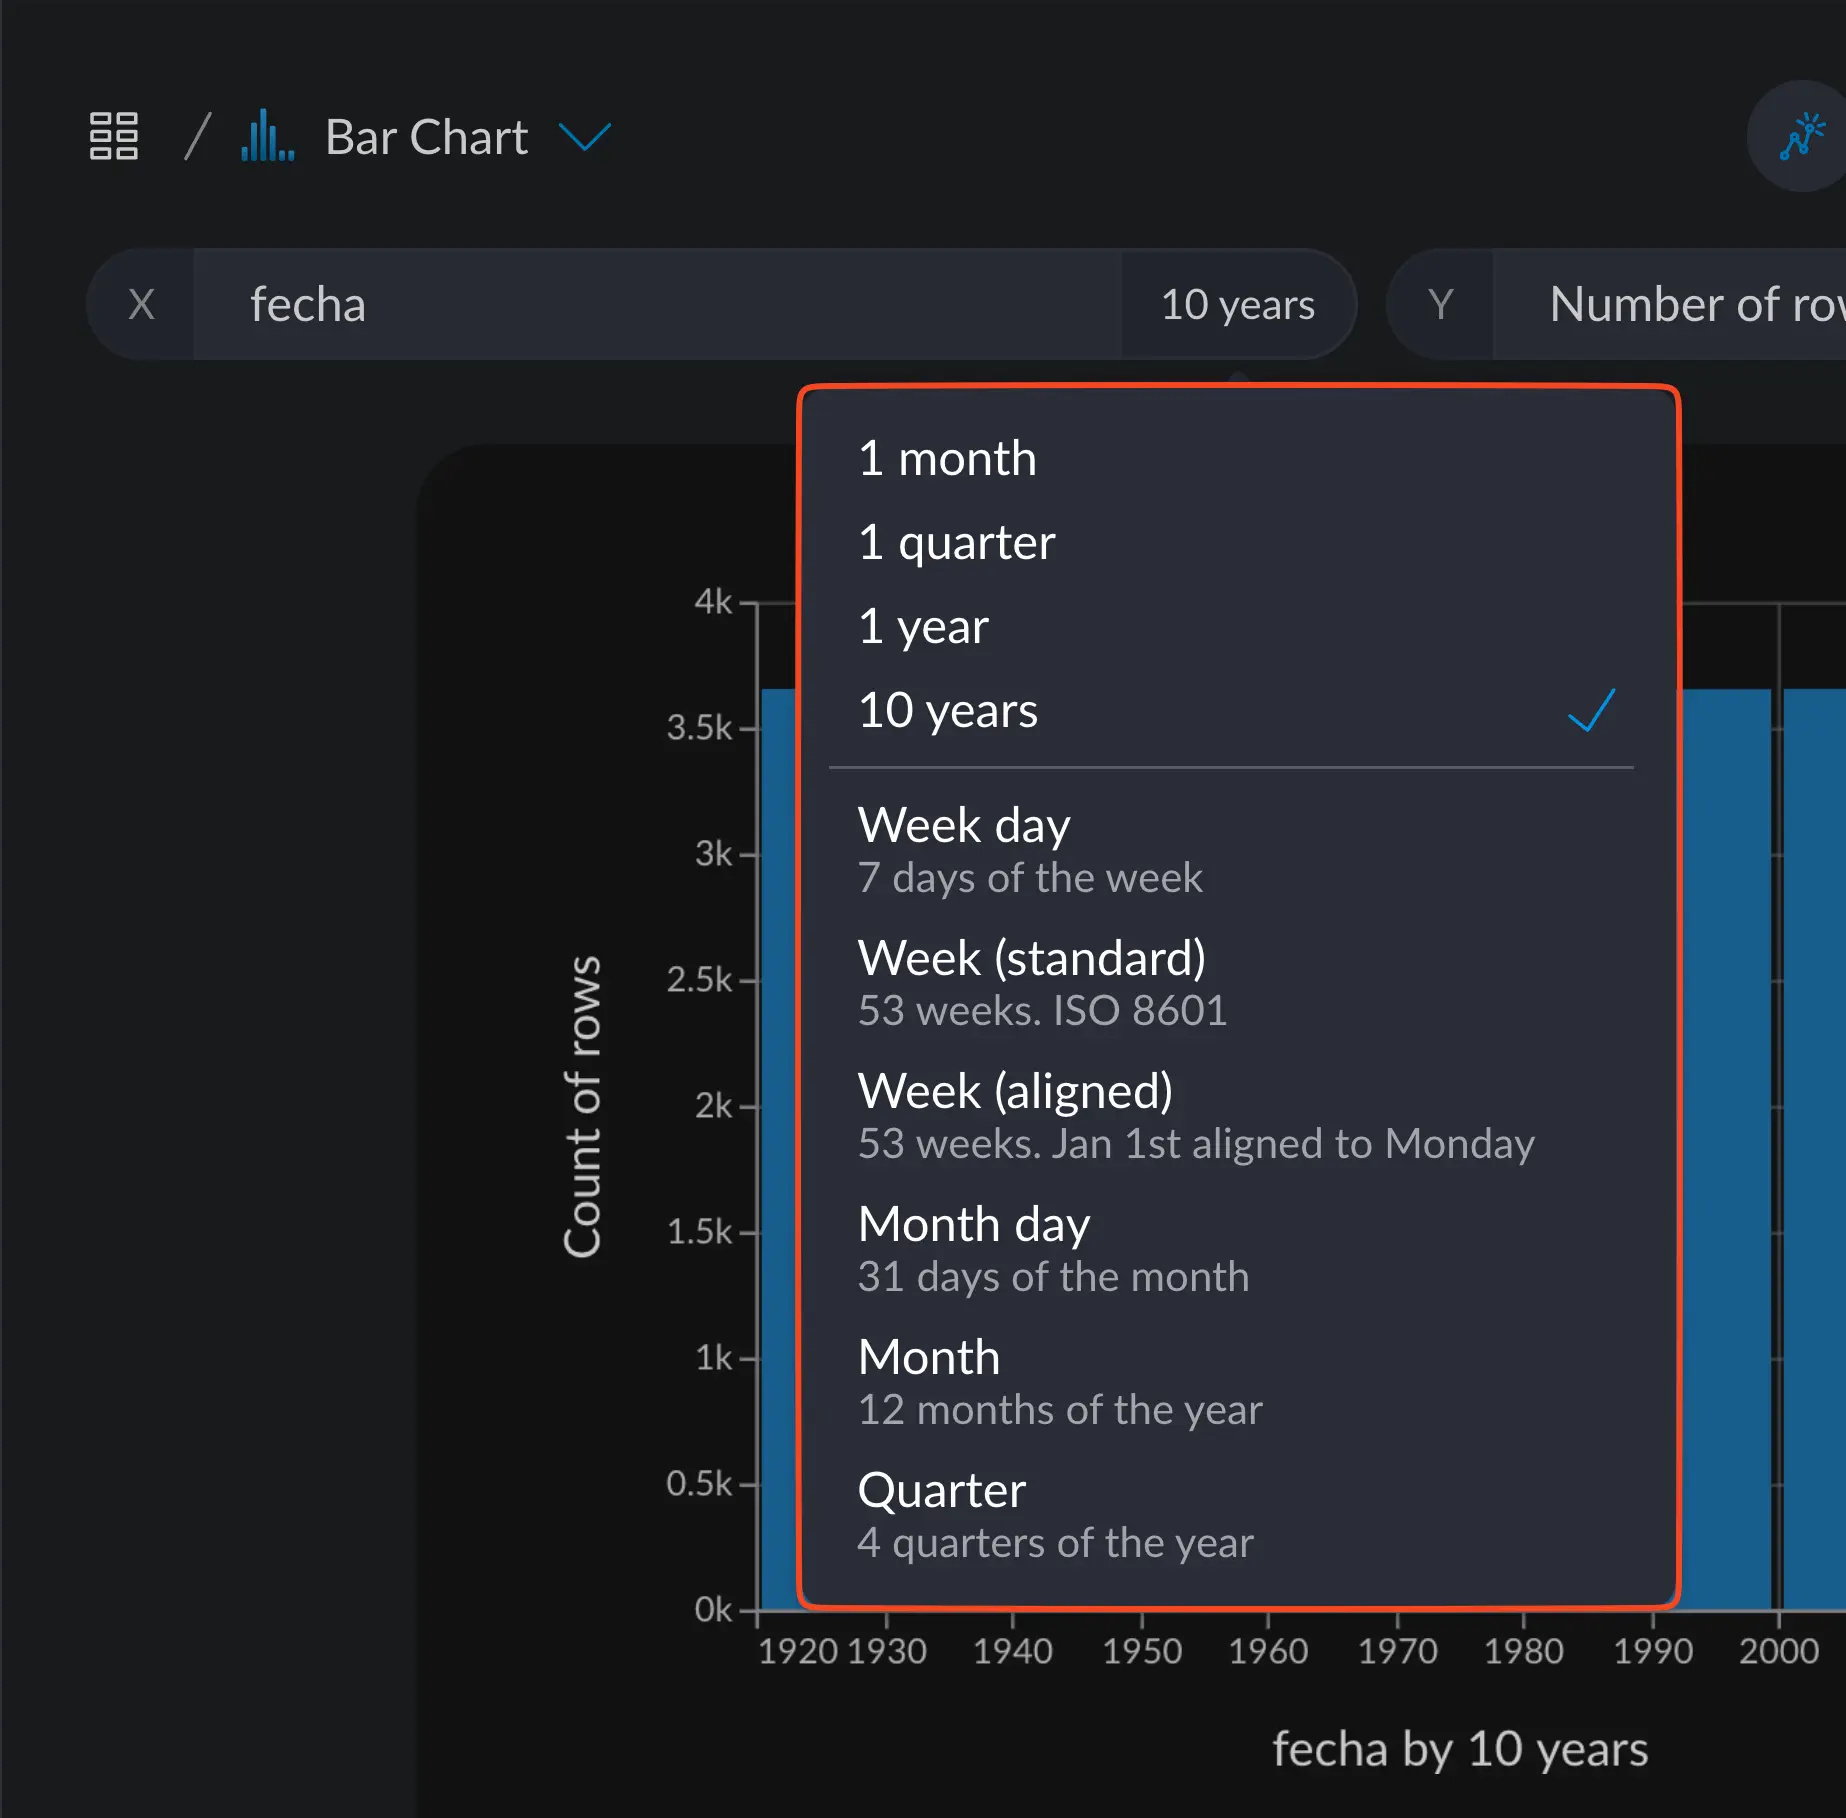
Temporal Axis
If the variable has a time component, the axis configuration will offer some options to aggregate data with
different “resolutions”. The smaller the time unit, the finer the visualization.
Particularly for dates, some semantically sensible options are given, such as grouping for each year,
week or quarters, among others.
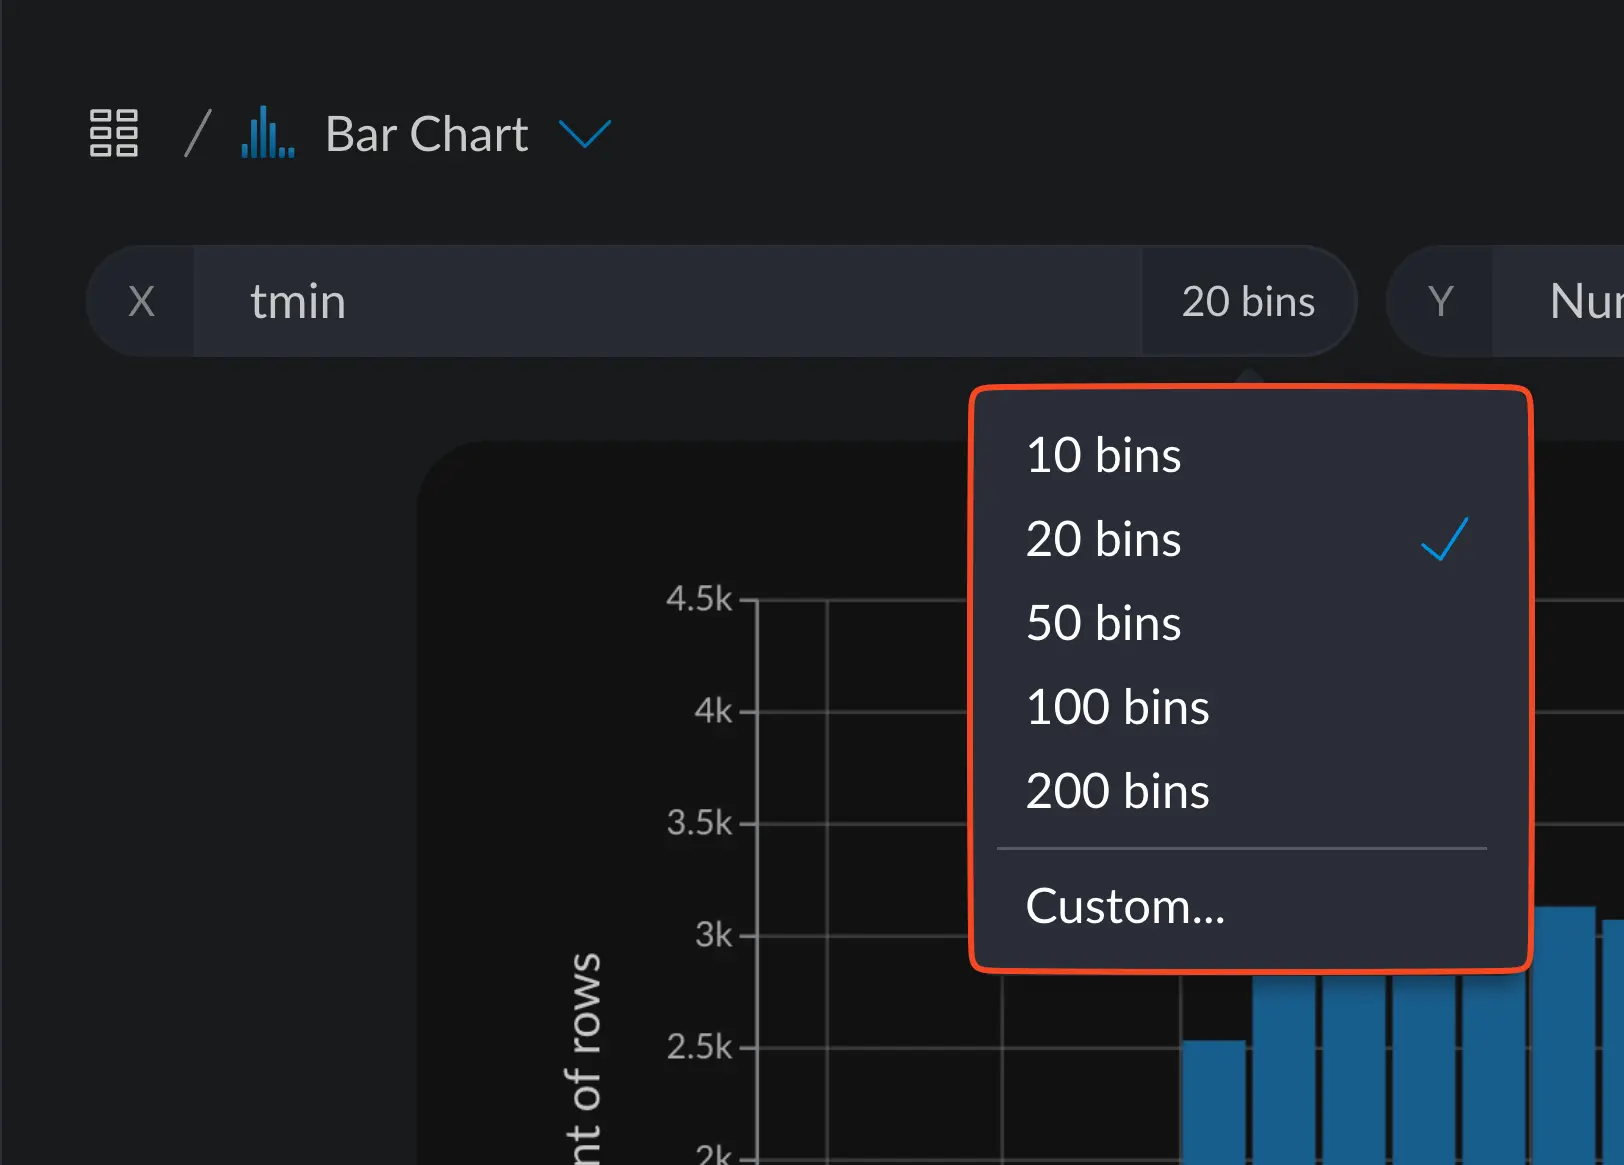
Numeric X axis
If the X axis is numeric, binning options are offered based on the extent (minimum and maxium) the column
has. “Binning” means to break down the whole range of values in intervals, like chunks, and then seeing
how many rows lie in that interval. We can then make aggregations on each of these groups, like counting, averages, medians,
and such.
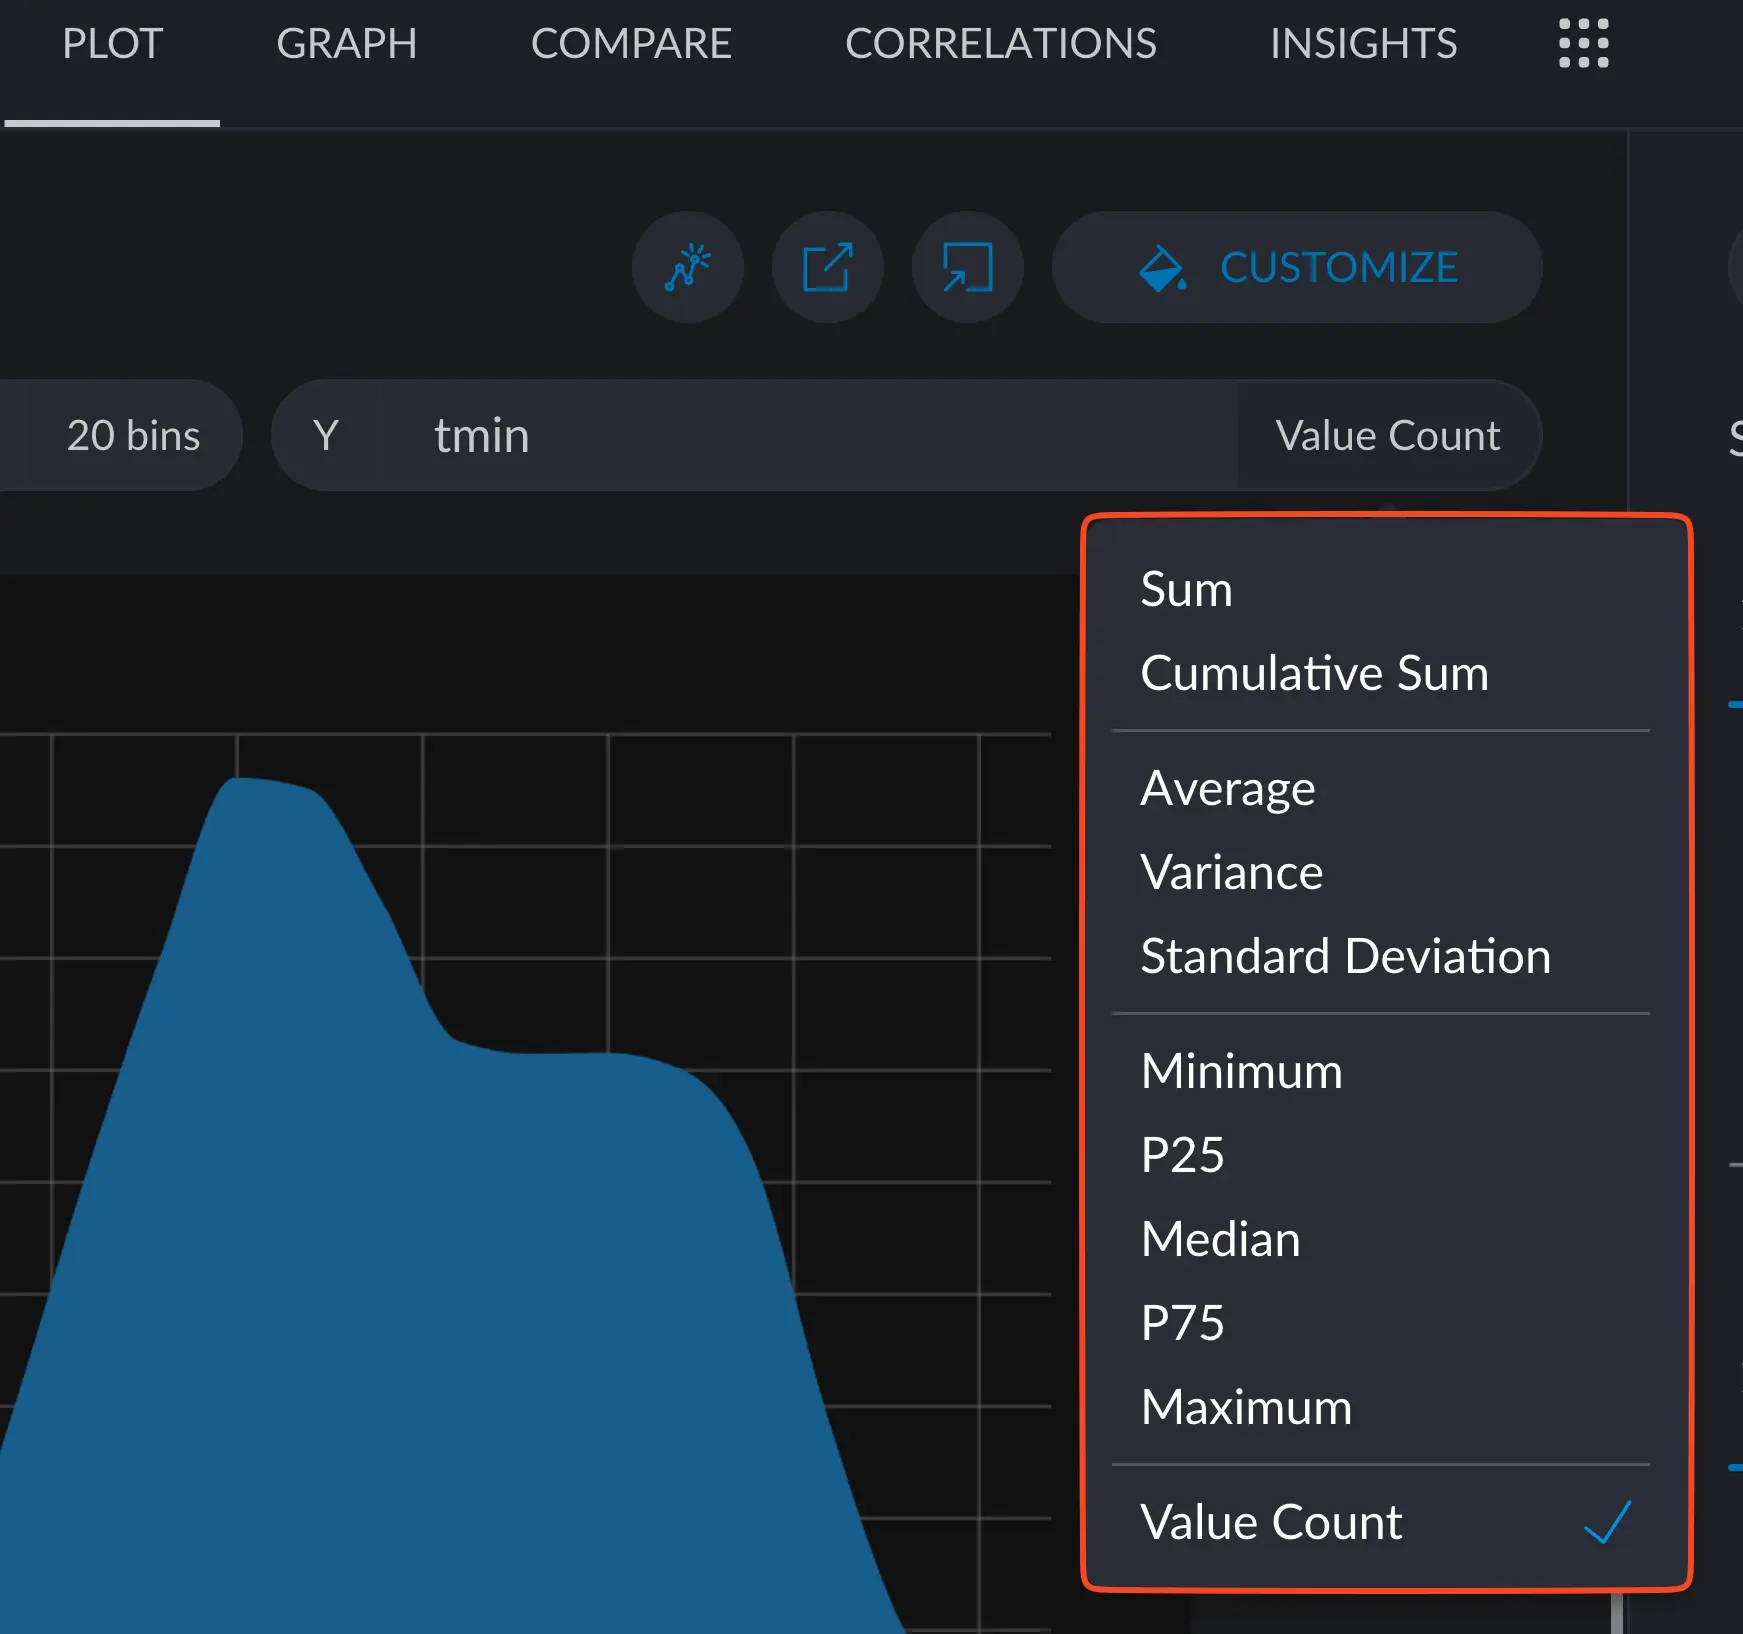
Numeric Y axis
If the Y axis is numeric, aggregation options like average, median or standard deviation are offered for you to explore.
Categorical Axis
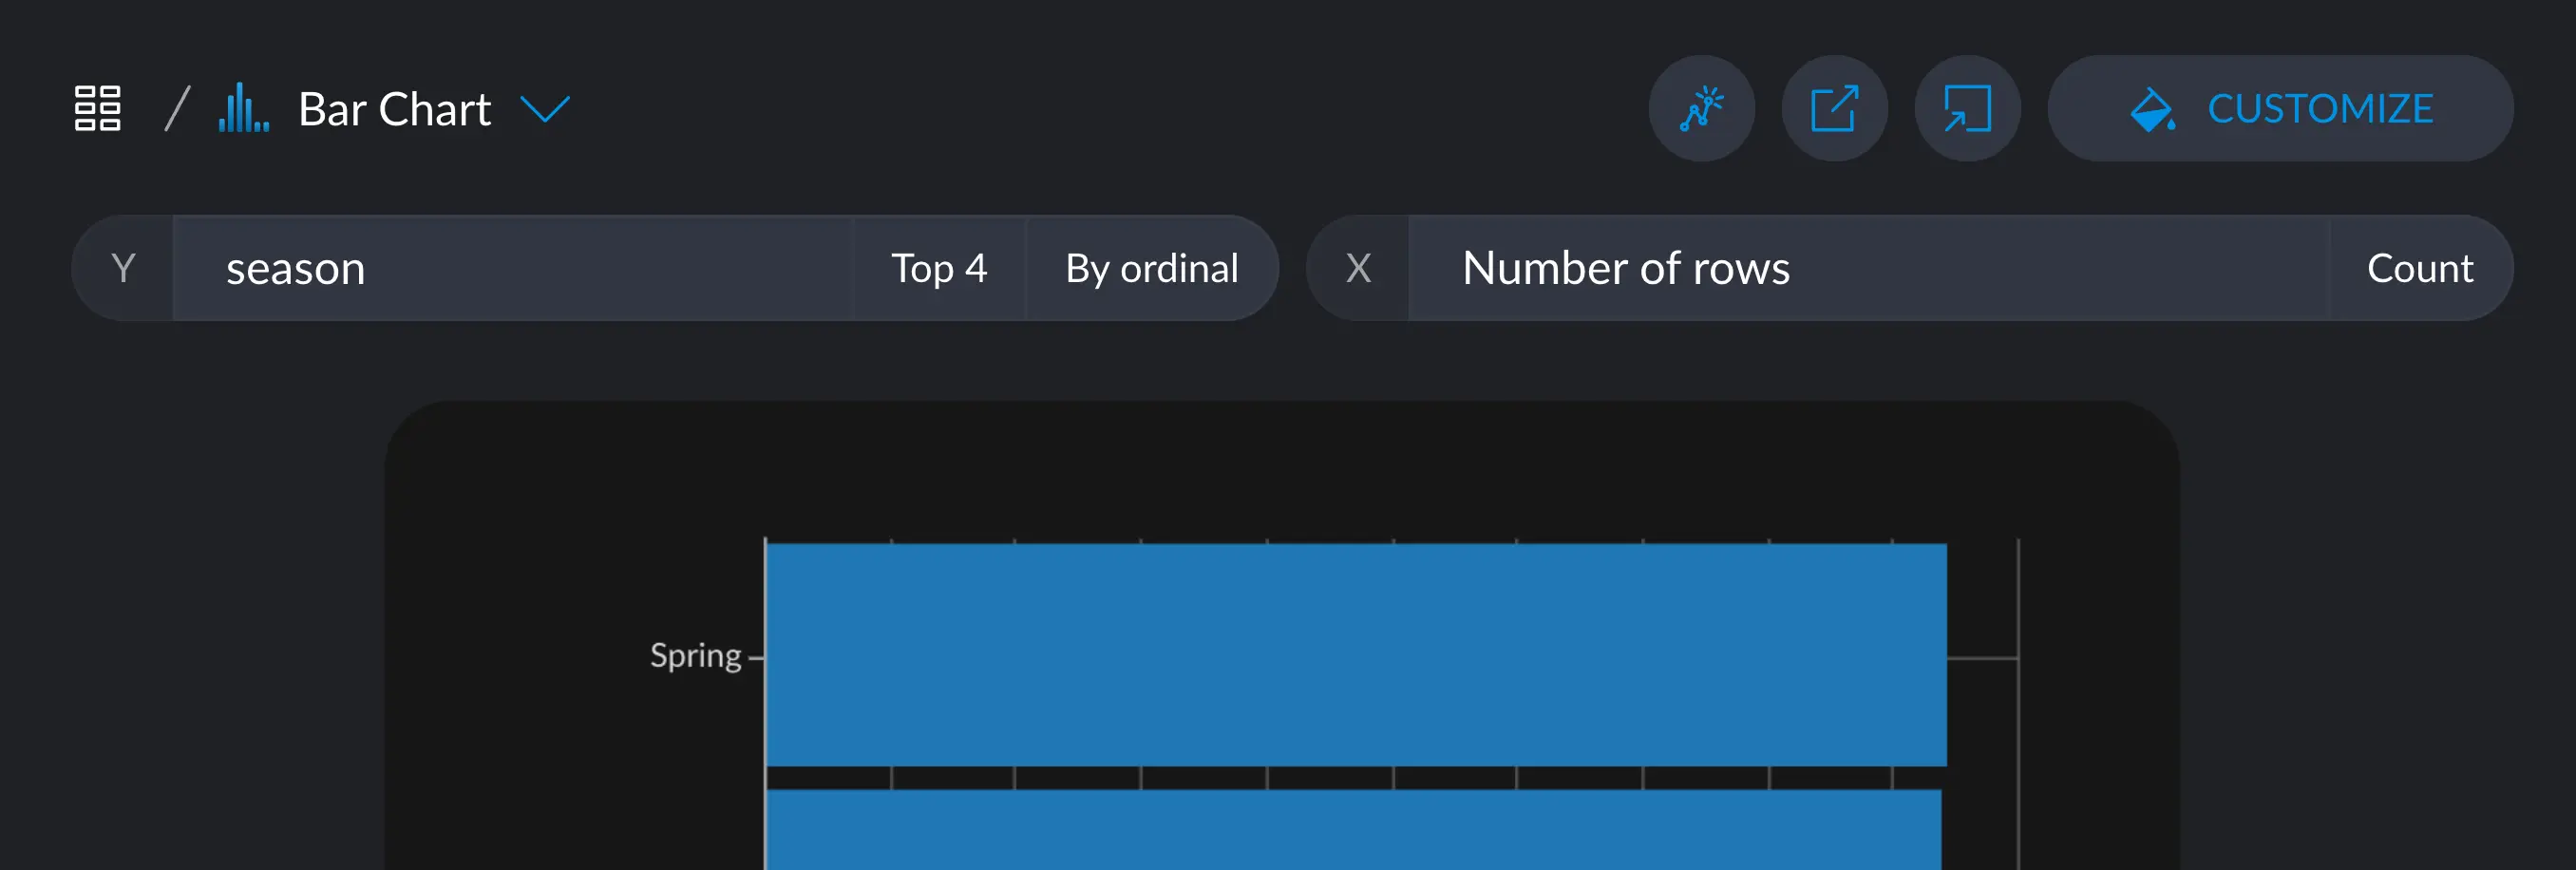
If the axis is categorical, we have two options to customize:
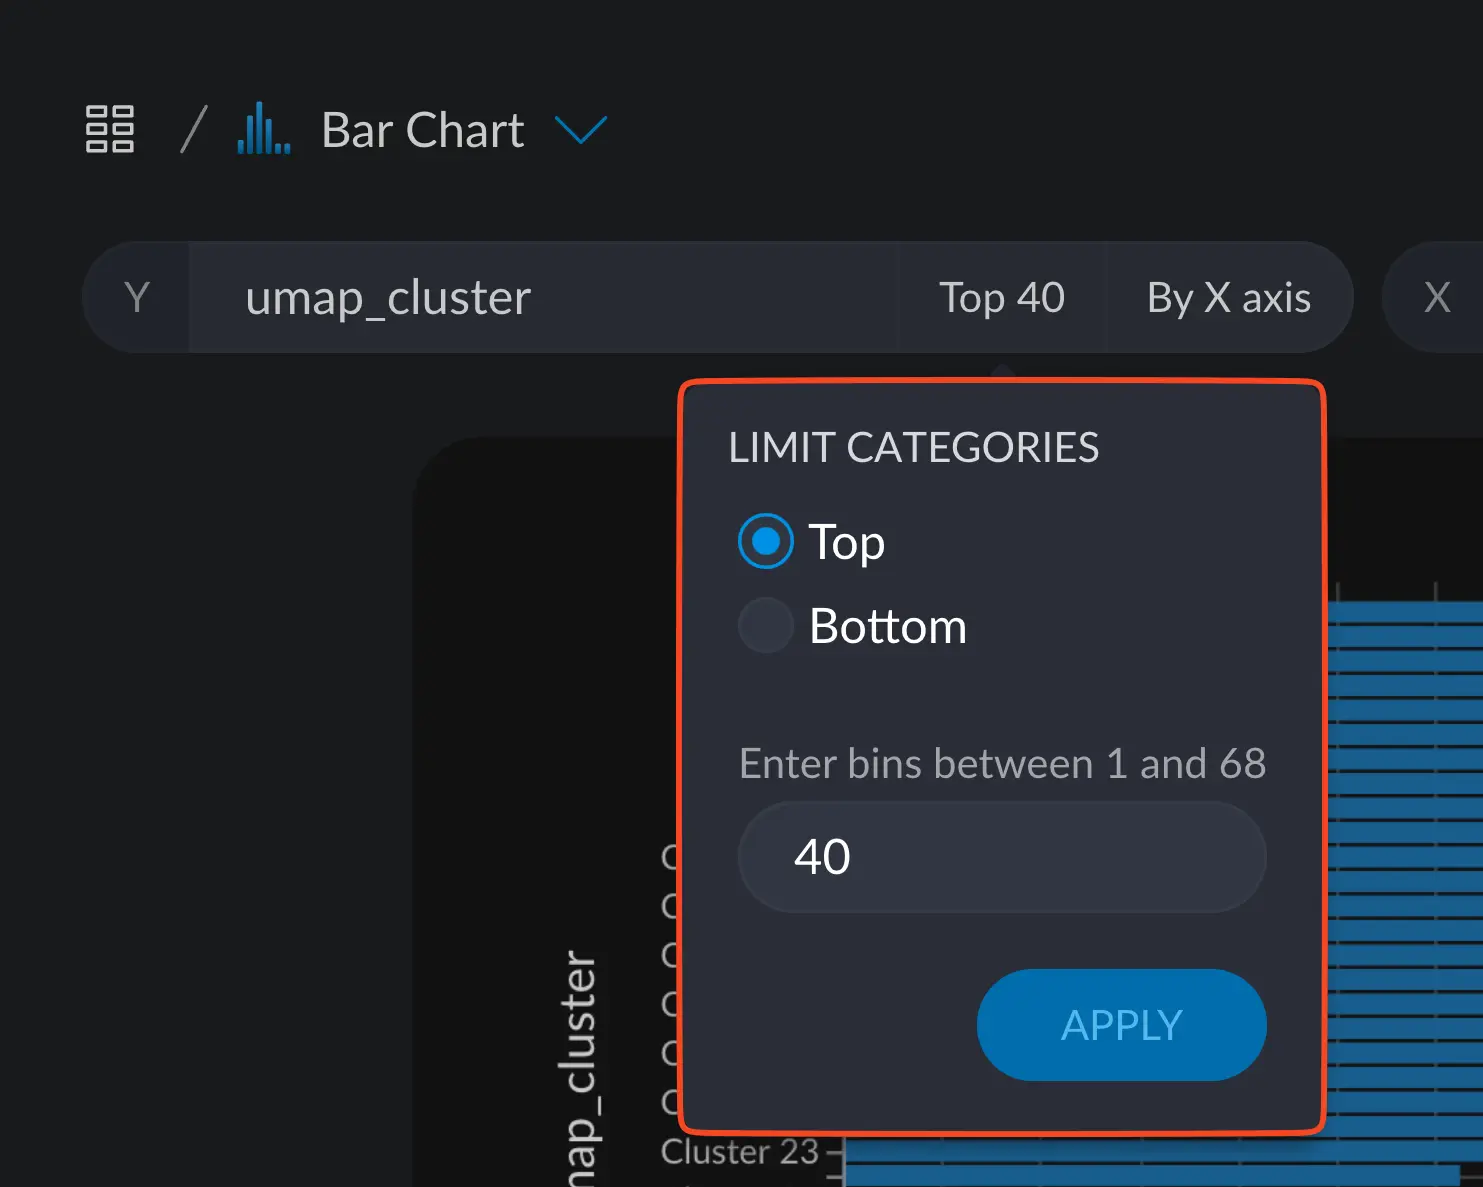
We can limit the number of categories and choose only the n “top” or “bottom” values for that category.
This helps in reducing potential noise for categories that don’t have much relevance in your visualization.
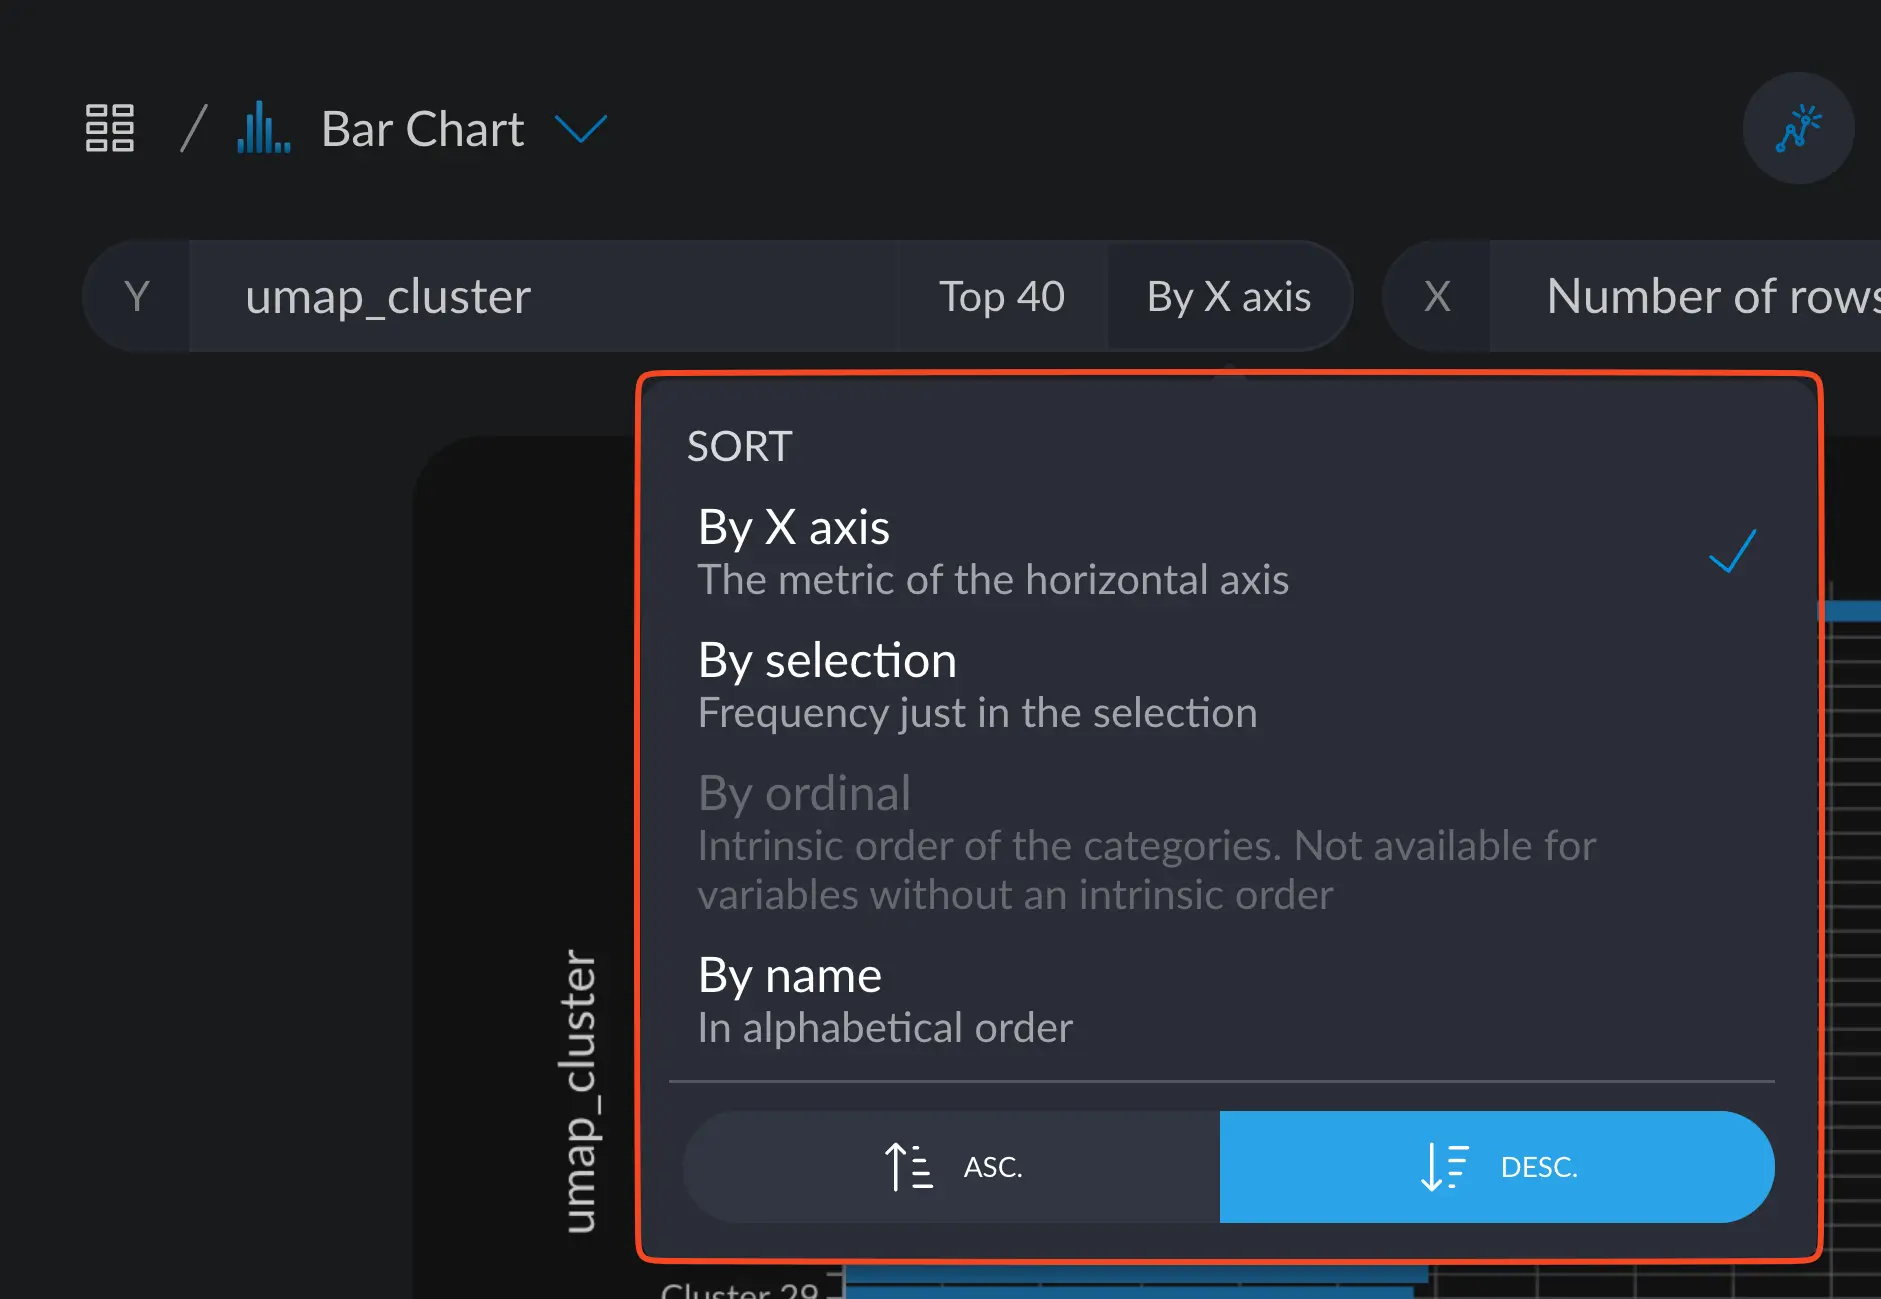
We can also sort these categories by some criteria, like the X axis metric, selection, ordinal or alphabetical order.
In general, this behavior is shared across the board, with some notable exceptions, like Box plots.
All particular cases are discussed in their corresponding page.
Number of rows
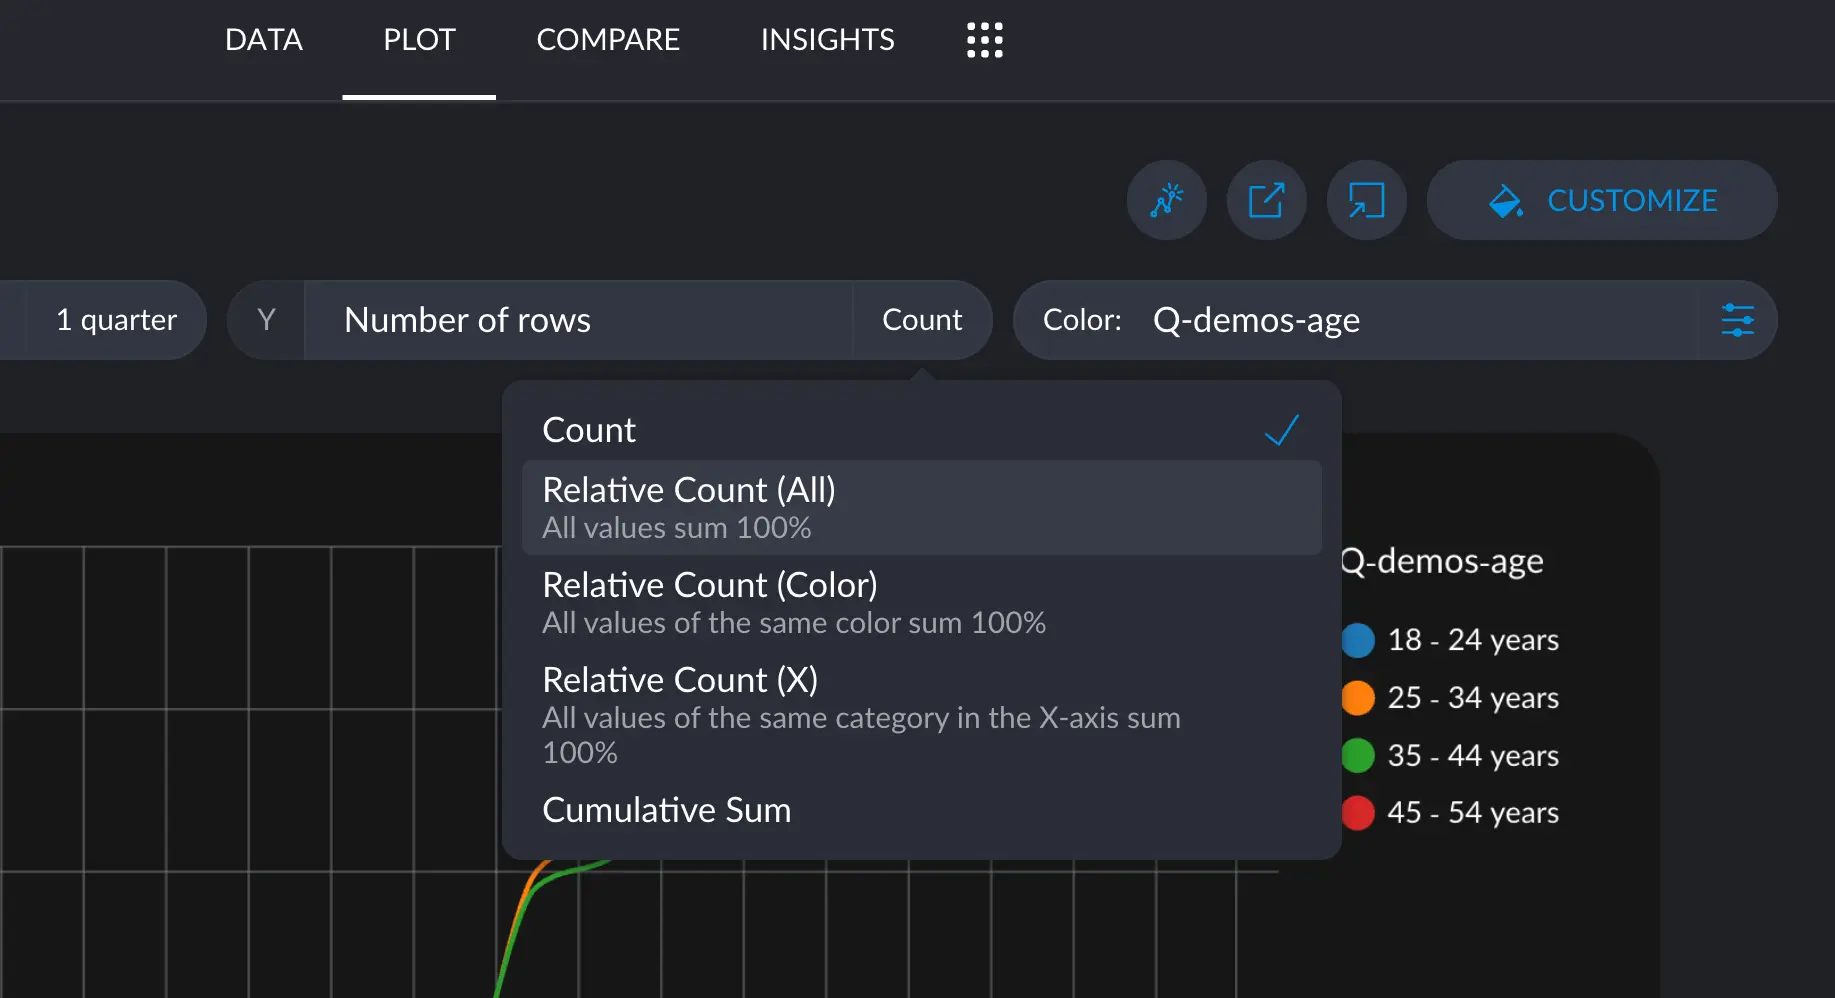
The option “number of rows” appears when you can have a sum up of a numeric value, like an average, sum or median.
With the number of rows, some options arise that are particularly interesting when searching for patterns. This can
all be expressed as relative comparisons between categorical values.
The most common, and default one, is the count, where we literally express the number of rows. But other operations can
be made.
Relative Count (All)
This method changes the scale to percentage, where now, instead of showing how many rows fall into these categories,
we show the percentage of rows.
In this example, we can see the proportion of gender in each age bracket. The left-most blue bar indicates that there
are ~89.6 transactions made by 18 – 24 years old women, which corresponds to 5.56% of the whole dataset.
These charts are interactive, use your mouse to explore!
Relative Count (Color)
The relative count by color changes the distribution so that each color must add up to 100%. This lets us know where a
particular segment is most over (or under) represented.
This answers the question “what’s the age distribution on women?”
For example: the tallest red bar indicates that most of the people that didn’t want to respond are between 25 – 34 years old.
Relative Count (X)
The relative count by X axis changes the distribution so that each individual segment adds up to 100%, showing a kind of
local distribution per each segment.
This answers the question of “what’s the gender distribution on people in the 18 – 24 age bracket?”
For example: among all the people in the 35 – 44 age bracket, 55% are women and 43.9% are men.
Cumulative Sum
The cumulative sum option allows you to see the rate of change of the number of rows between a given segment and the
next.
This answers the question “how many men under 54 years do we have in our data?” which corresponds to the fourth
orange bar in the example: 577K.
