Interface Overview
The chart builder interface is designed to facilitate the creation of various chart types for data visualization. Below is a breakdown of each element present in the interface: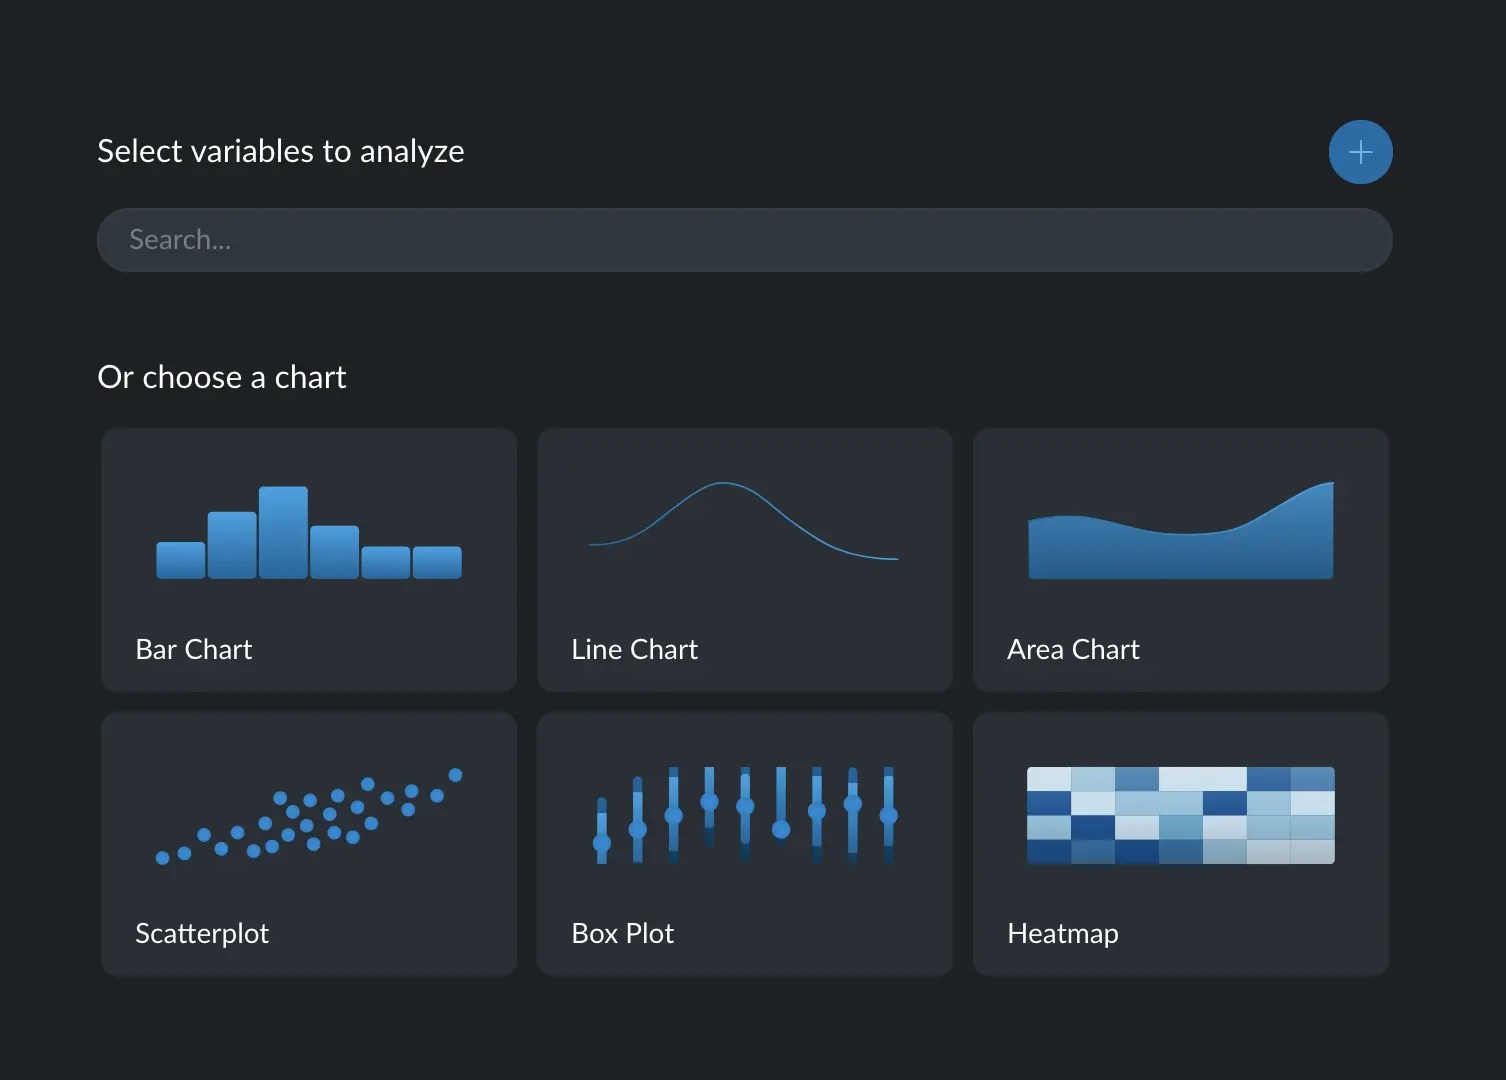
1. Select Variables to Analyze
- Search Bar: Allows you to quickly find and select the variables you wish to analyze. You may type the name of the variable into the search field.
- Add Button (+): This button, located on the right side above the chart options, allows you to add additional variables to the analysis.
2. Choose a Chart Section
This section provides a gallery of chart types to choose from. Each chart option comes with a representative icon and is selectable to create that specific type of visualization. Each chart comes with a set of more complete variants. To explore the different variants available for each chart type, simply hover your cursor over the specific chart’s card. Each variant is symbolized by a unique icon. For instance, when you hover over the ‘Bar Chart’, you’ll see variants like ‘Stacked Bar Chart’ or ‘Grouped Bar Chart’.Two ways of creating a chart
There are two different ways to creating a chart:- Guided: when you have identified the variables you wish to visualize, but haven’t decided on the specific chart type.
- Off-road: when you have a specific chart type in mind, and the selection of variables to be used will be made subsequently.