Introduction
UMAP and our proprietary k-NN graph treat the relative balance between categorical and numeric data differently, leading most of the time to qualitatively different embeddings. The k-NNG method has a tendency to clearly separate the network into clusters such that each cluster corresponds to a combination of categories (across different variables). UMAP tends to not divide the network as sharply based on categorical columns, yet can be configured to give them more or less influence on the resulting embedding.Example 1 – Human resources data
As a first example, we use a human resources dataset with 10 numeric and 2 categorical columns. The categorical columns represent the salary of employees (3 levels) and their department (10 levels). We will also be showing two numeric columns: the number of projects (integer values from 2 to 7), and satisfaction level (continuous in [0, 1]).k-NNG embedding
The k-NNG method produces the following layout: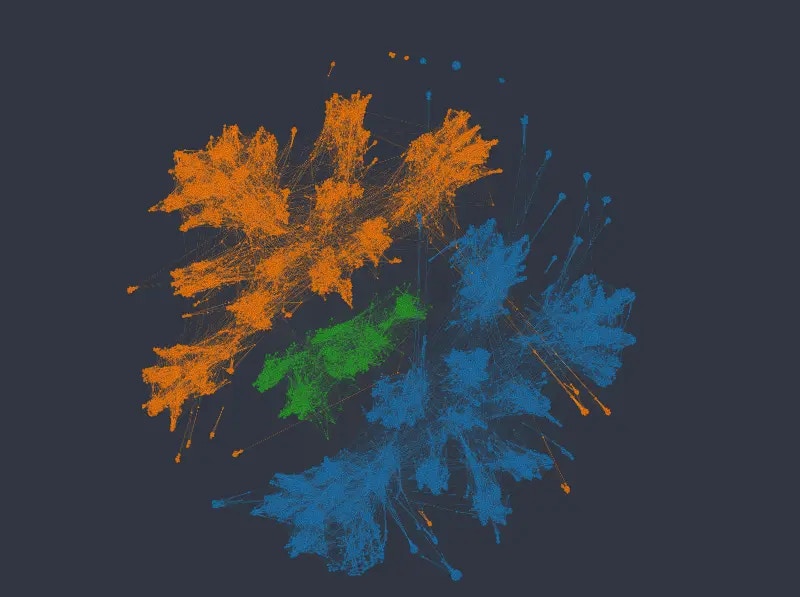
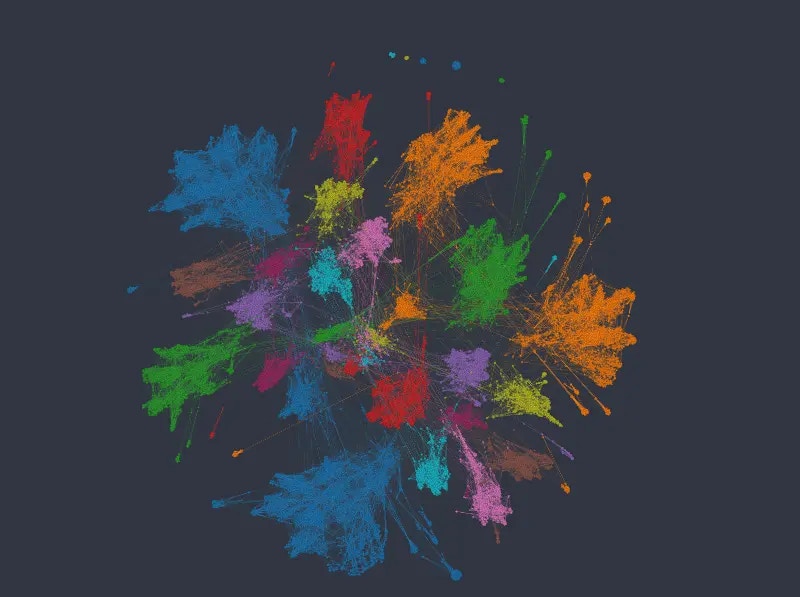
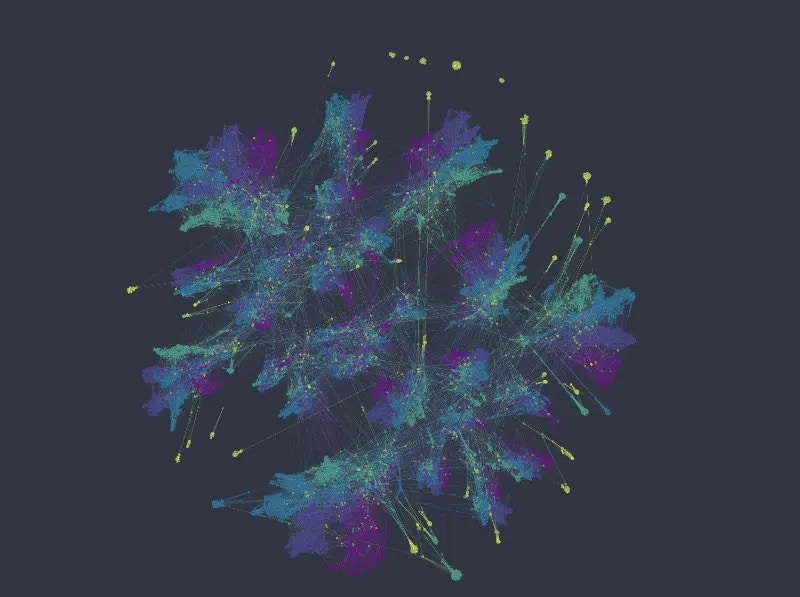
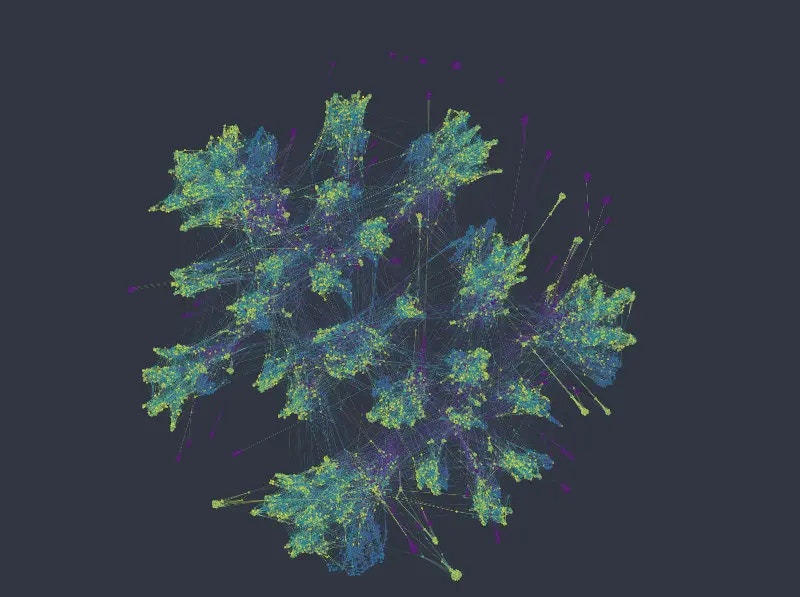
Figure 1: K-nn graph colored from top to bottom and left to right by salary, department, number of projects, and satisfaction level.
UMAP embedding
Using UMAP has the advantage of giving us more influence on the relative importance of categorical vs numeric variables. In Graphext, this can be done with thetype_weights parameter, e.g.
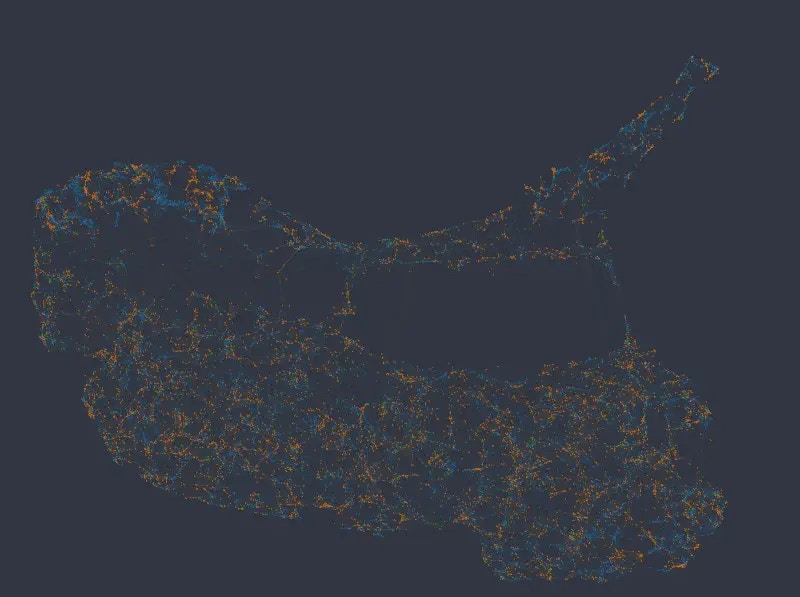
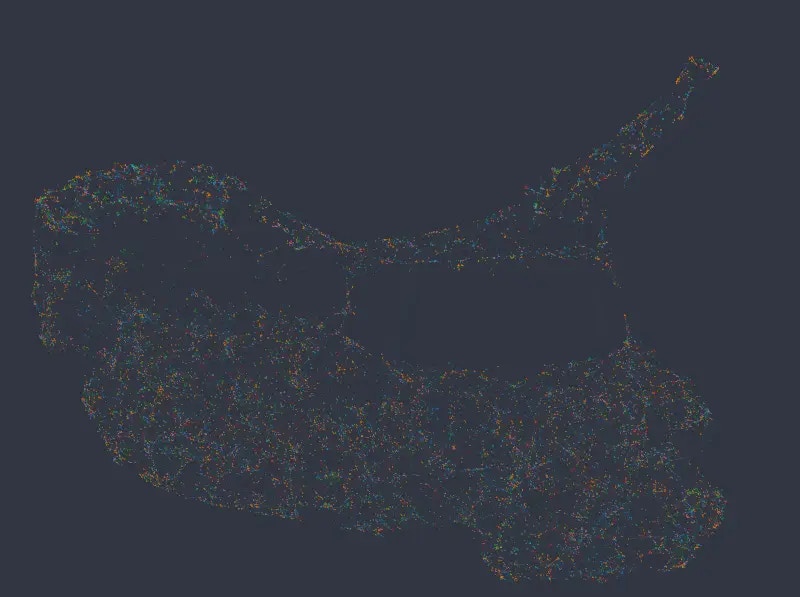
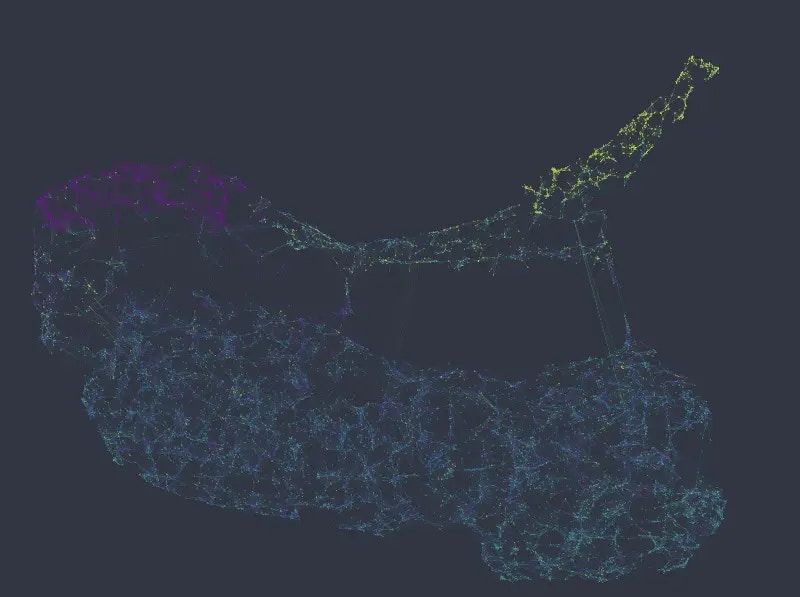
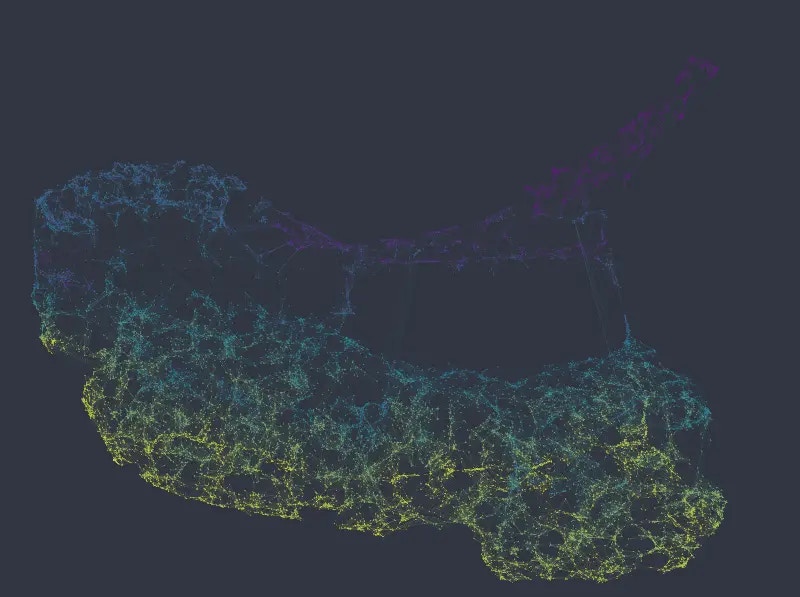
Figure 2: UMAP embedding colored from top to bottom and left to right by salary, department, number of projects, and satisfaction level (i.e. equivalent to Figure 1).
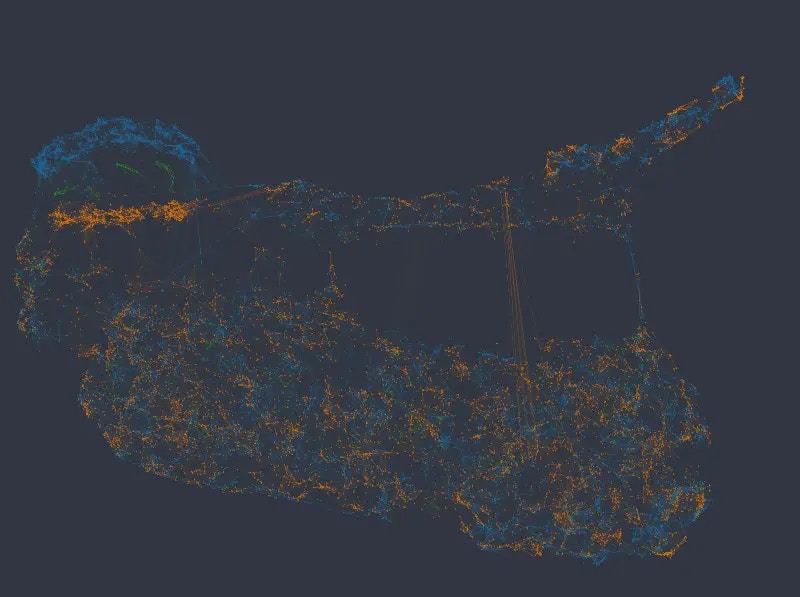
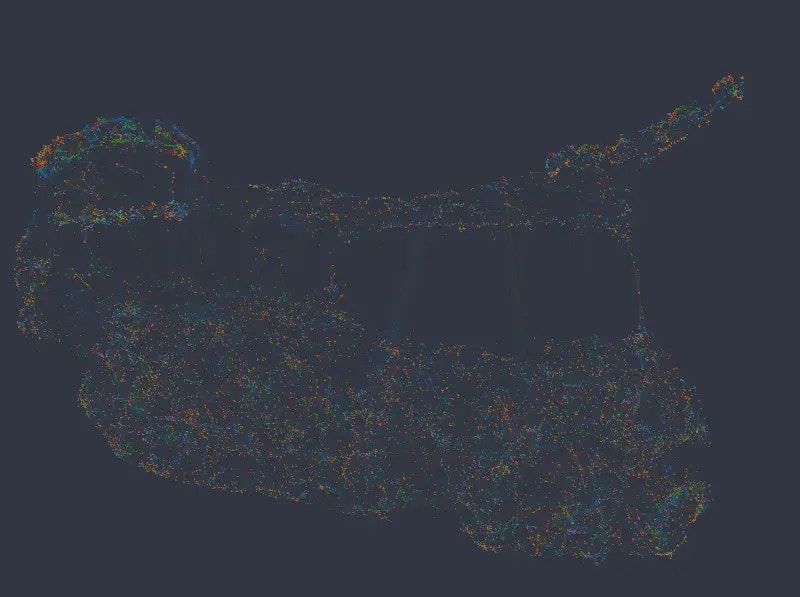
Figure 3: Color mapped to salary and department, categorical weight of 6.0.
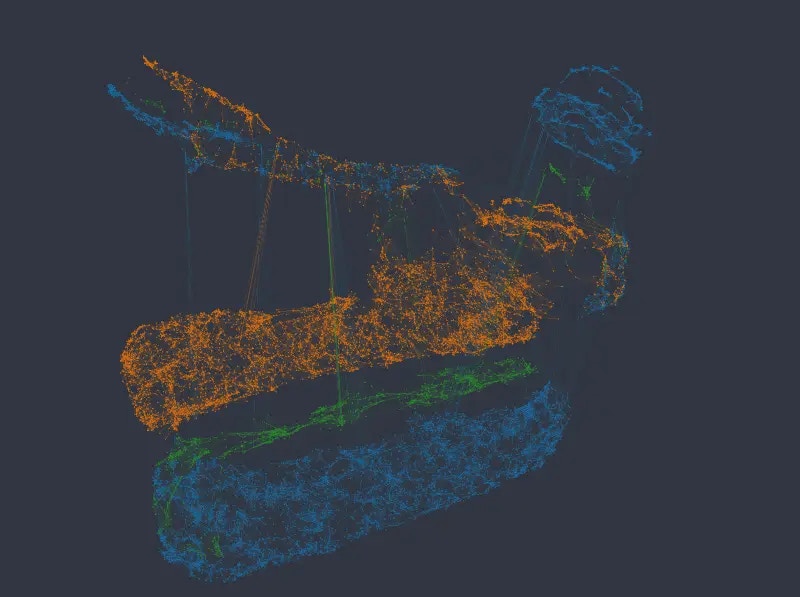

Figure 4: Color mapped to salary and department, categorical weight of 8.0.
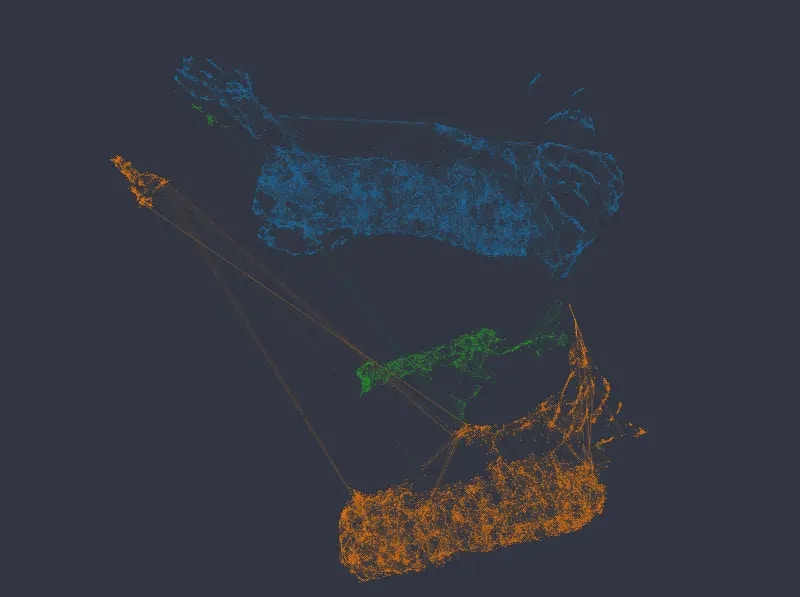
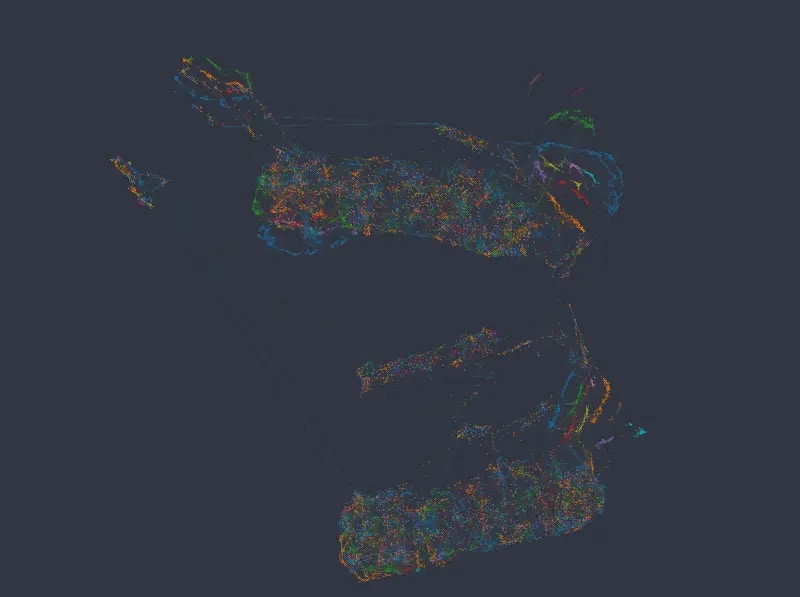
Figure 5: .Color mapped to salary and department, categorical weight of 10.0.
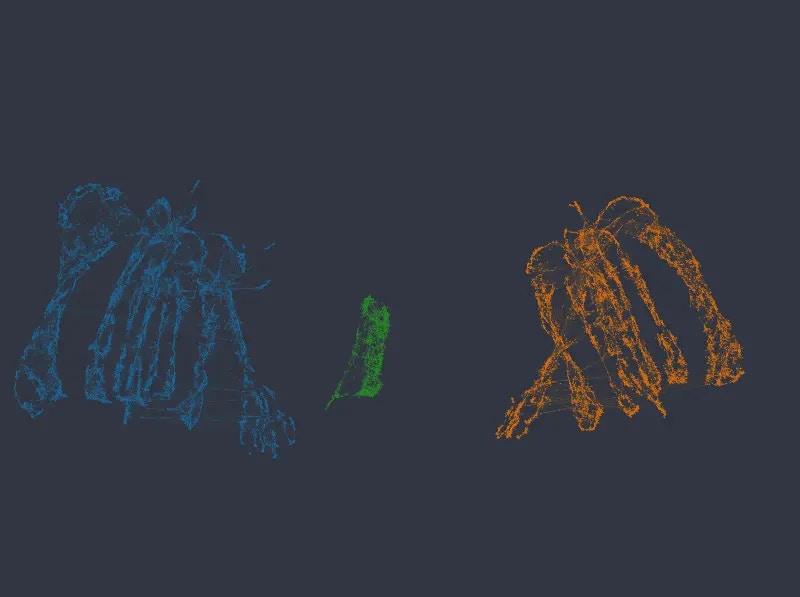
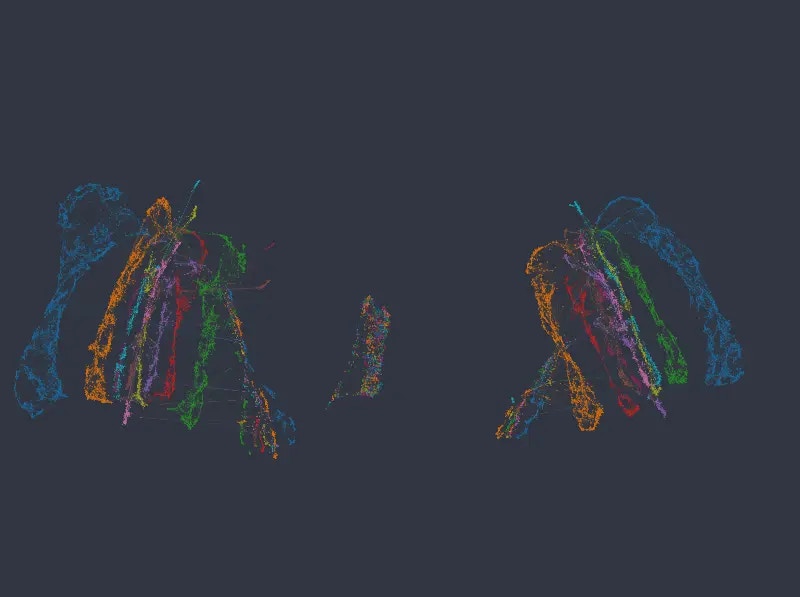
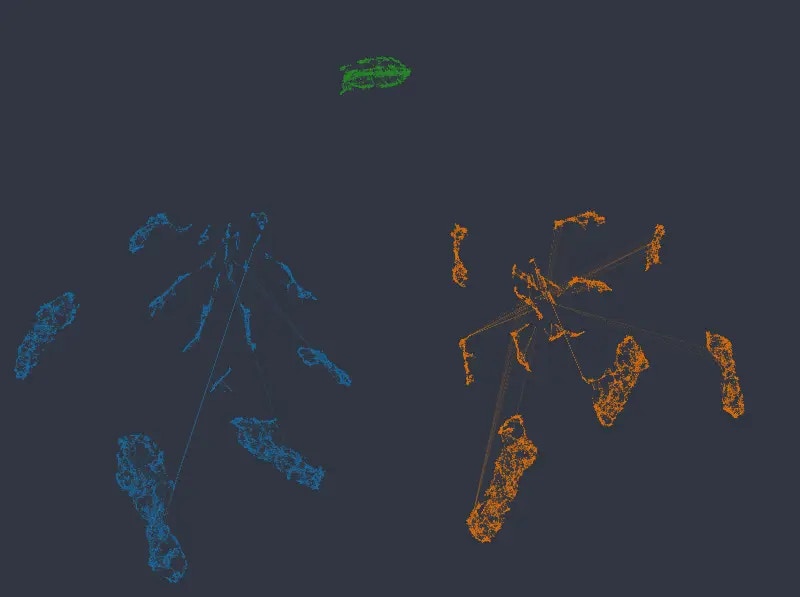
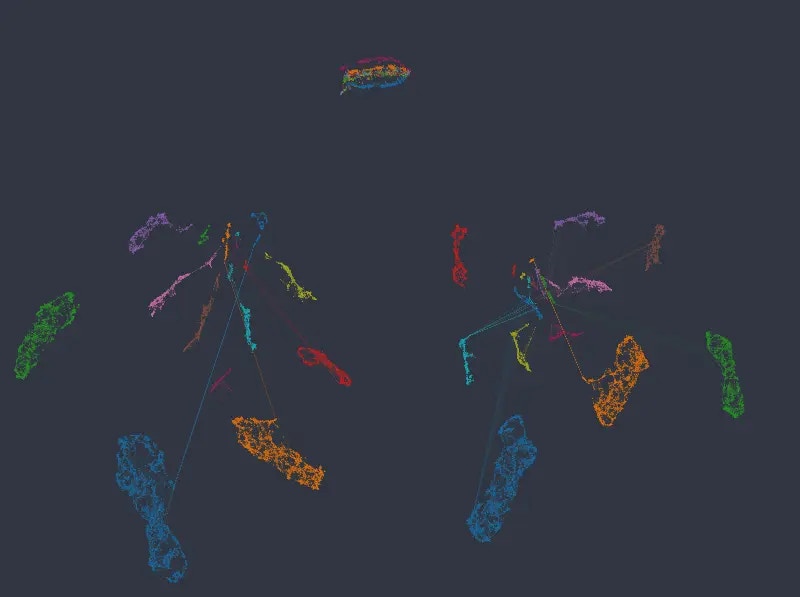
Figure 6: Color mapped to salary and department, categorical weight of 12.0 (first row) and 14.0 (second row).
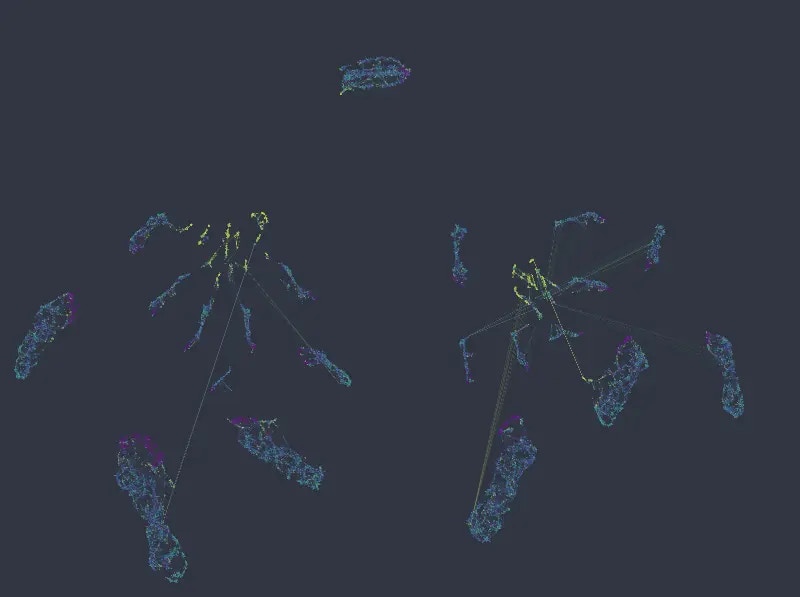
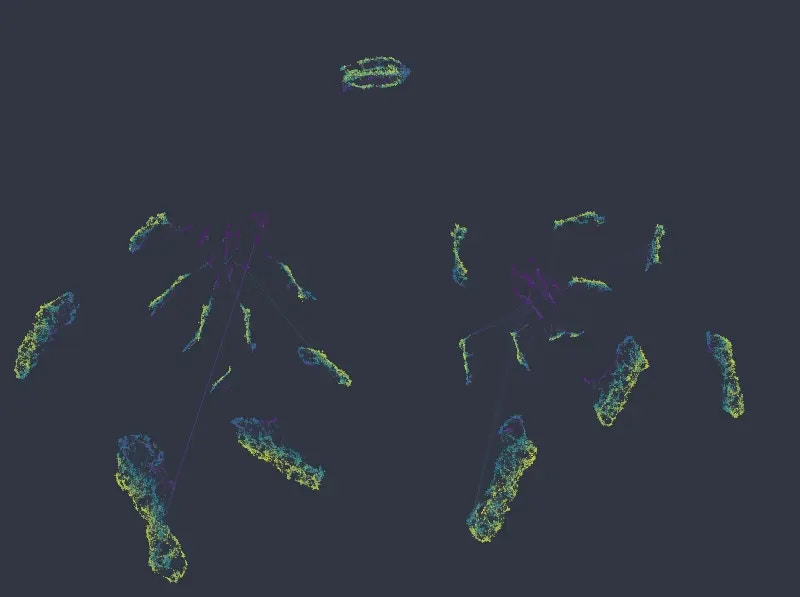
Figure 7: Color mapped to numeric columns number of projects, and satisfaction level, categorical weight of 14.0.
Example 2 – Titanic dataset
As a another example we will look at (a subset of) the Titanic dataset, which for each passenger contains 3 categorical columns (sex, passenger class, and port of embarkment), and 4 numeric columns (age, number of siblings and spouses aboard, number of parents and children aboard, and fare price).k-NNG embedding
The k-NNG method produces the following layout (double-click on an image to see a bigger version):
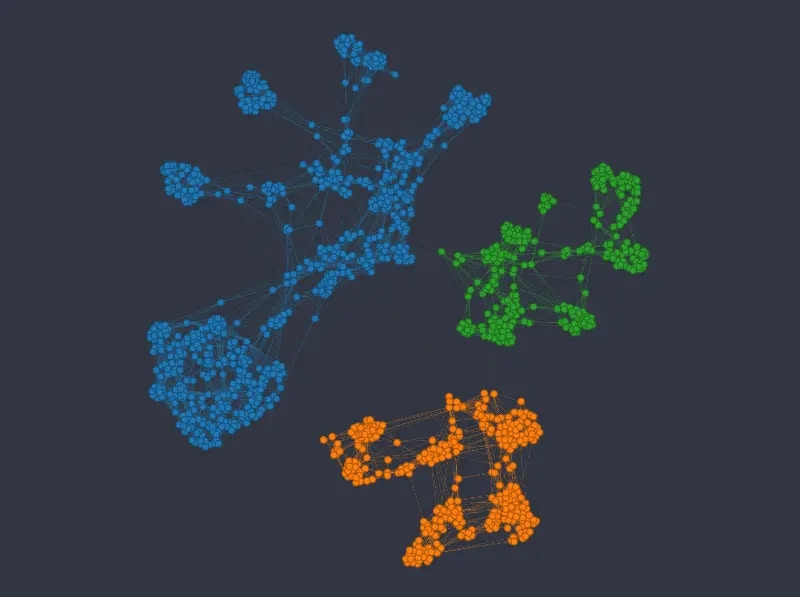
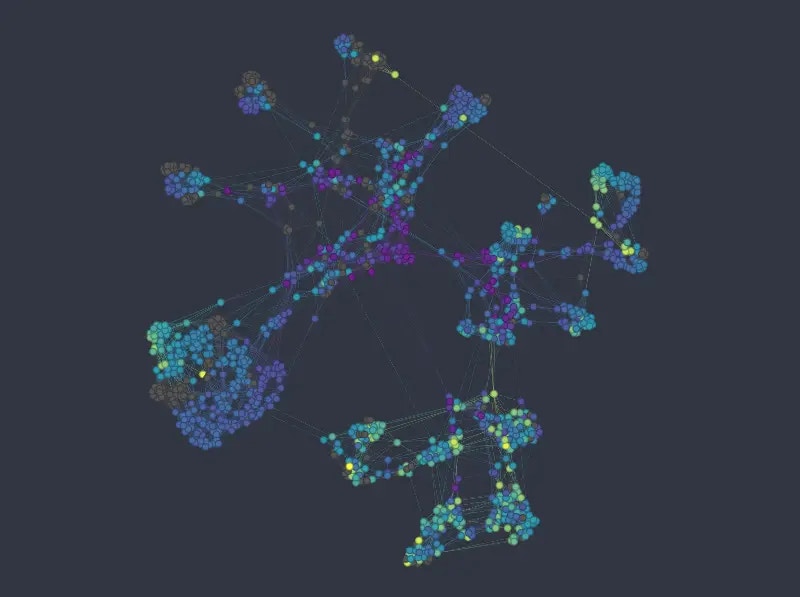
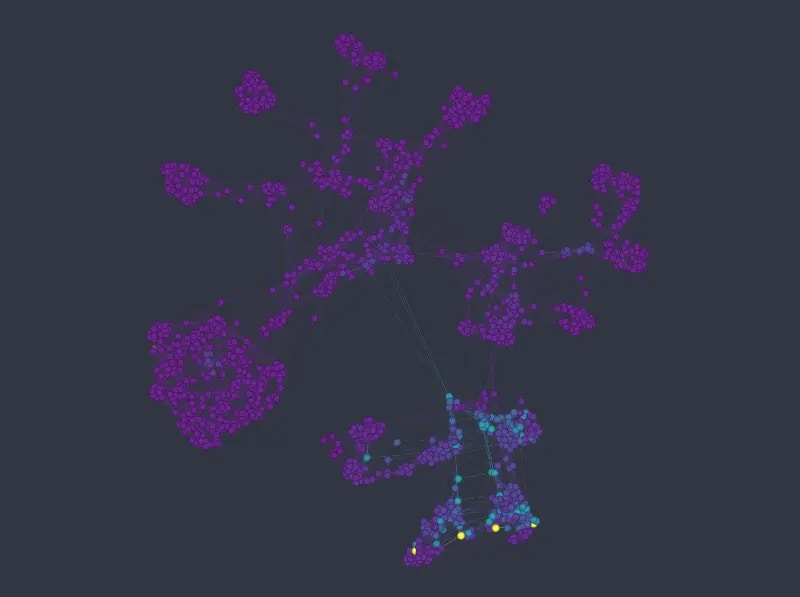
Figure 8: K-nn graph colored from top to bottom and left to right by sex, passenger class, age, and fare price
UMAP embedding
For this dataset, using UMAP with default column weights seems to achieve a good balance between categorical and numerical variables out of the box (note that in the following figures we changed themin_dist, and n_epochs parameters only, as with default values the resulting layout is rather thinly spread):
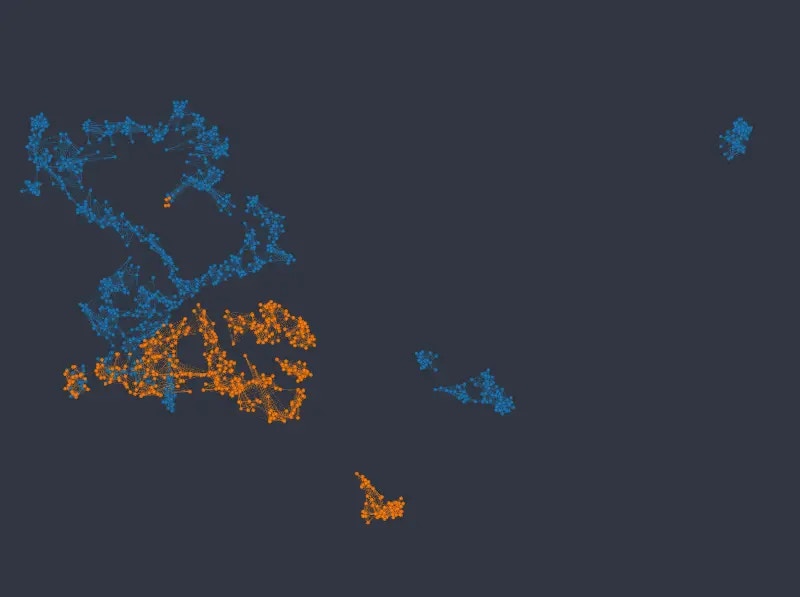
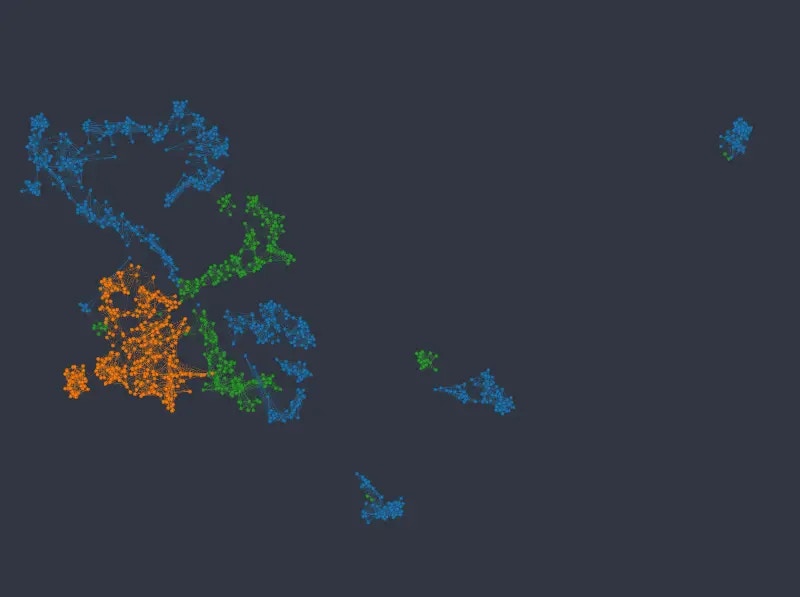
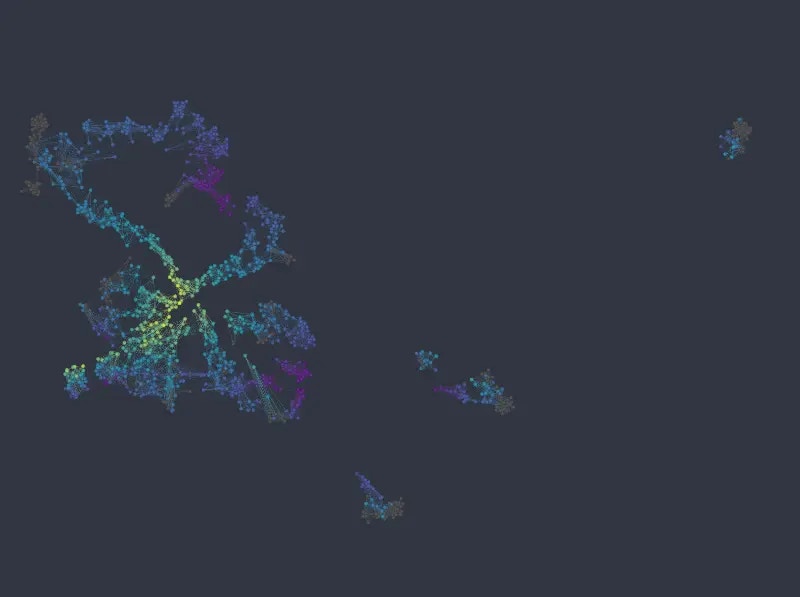
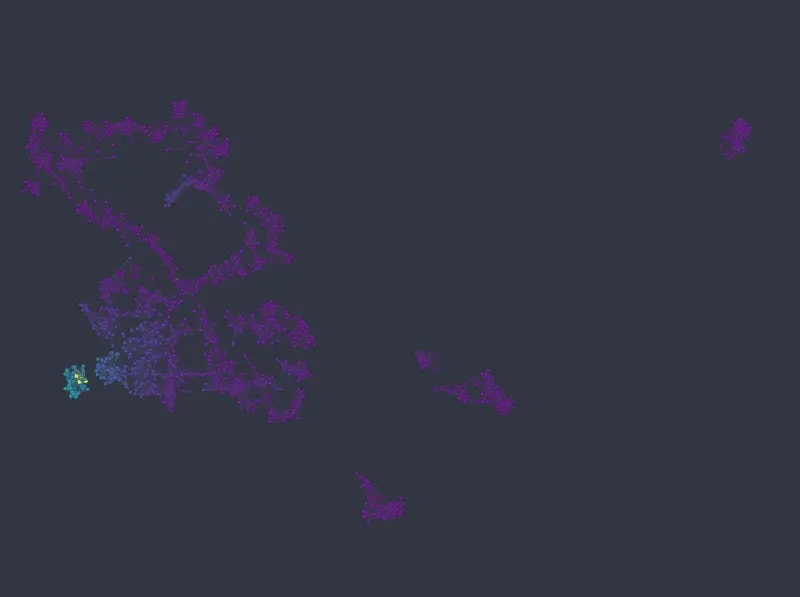
Figure 9: UMAP embedding colored from top to bottom and left to right by sex, passenger class, age, and fare price.