> ## Documentation Index
> Fetch the complete documentation index at: https://docs.graphext.com/llms.txt
> Use this file to discover all available pages before exploring further.
# Saving insights in a project
> Take snapshots of your data for later inspection
An [Insight](/concepts/graphext-concepts/insights) represents a snapshot of your data in the process of searching for relationships or information.
When performing a series of cross filters or a plot composition, that is a potential insight. In case you want to reproduce the state of the app at that stage, you can save an insight like this
## Saving Variables
To save an insight on how a variable reacts to another,
you can go to the options button next to the variable you are interested in,
and click save insight.
## Saving Plots
If you want to save a plot you’ve composed, you can click the “Save Insight” button.
## Saving Graphs
To save a Graph as an Insight, you can click the “Save Insight” button in the upper right corner of the Graph view.
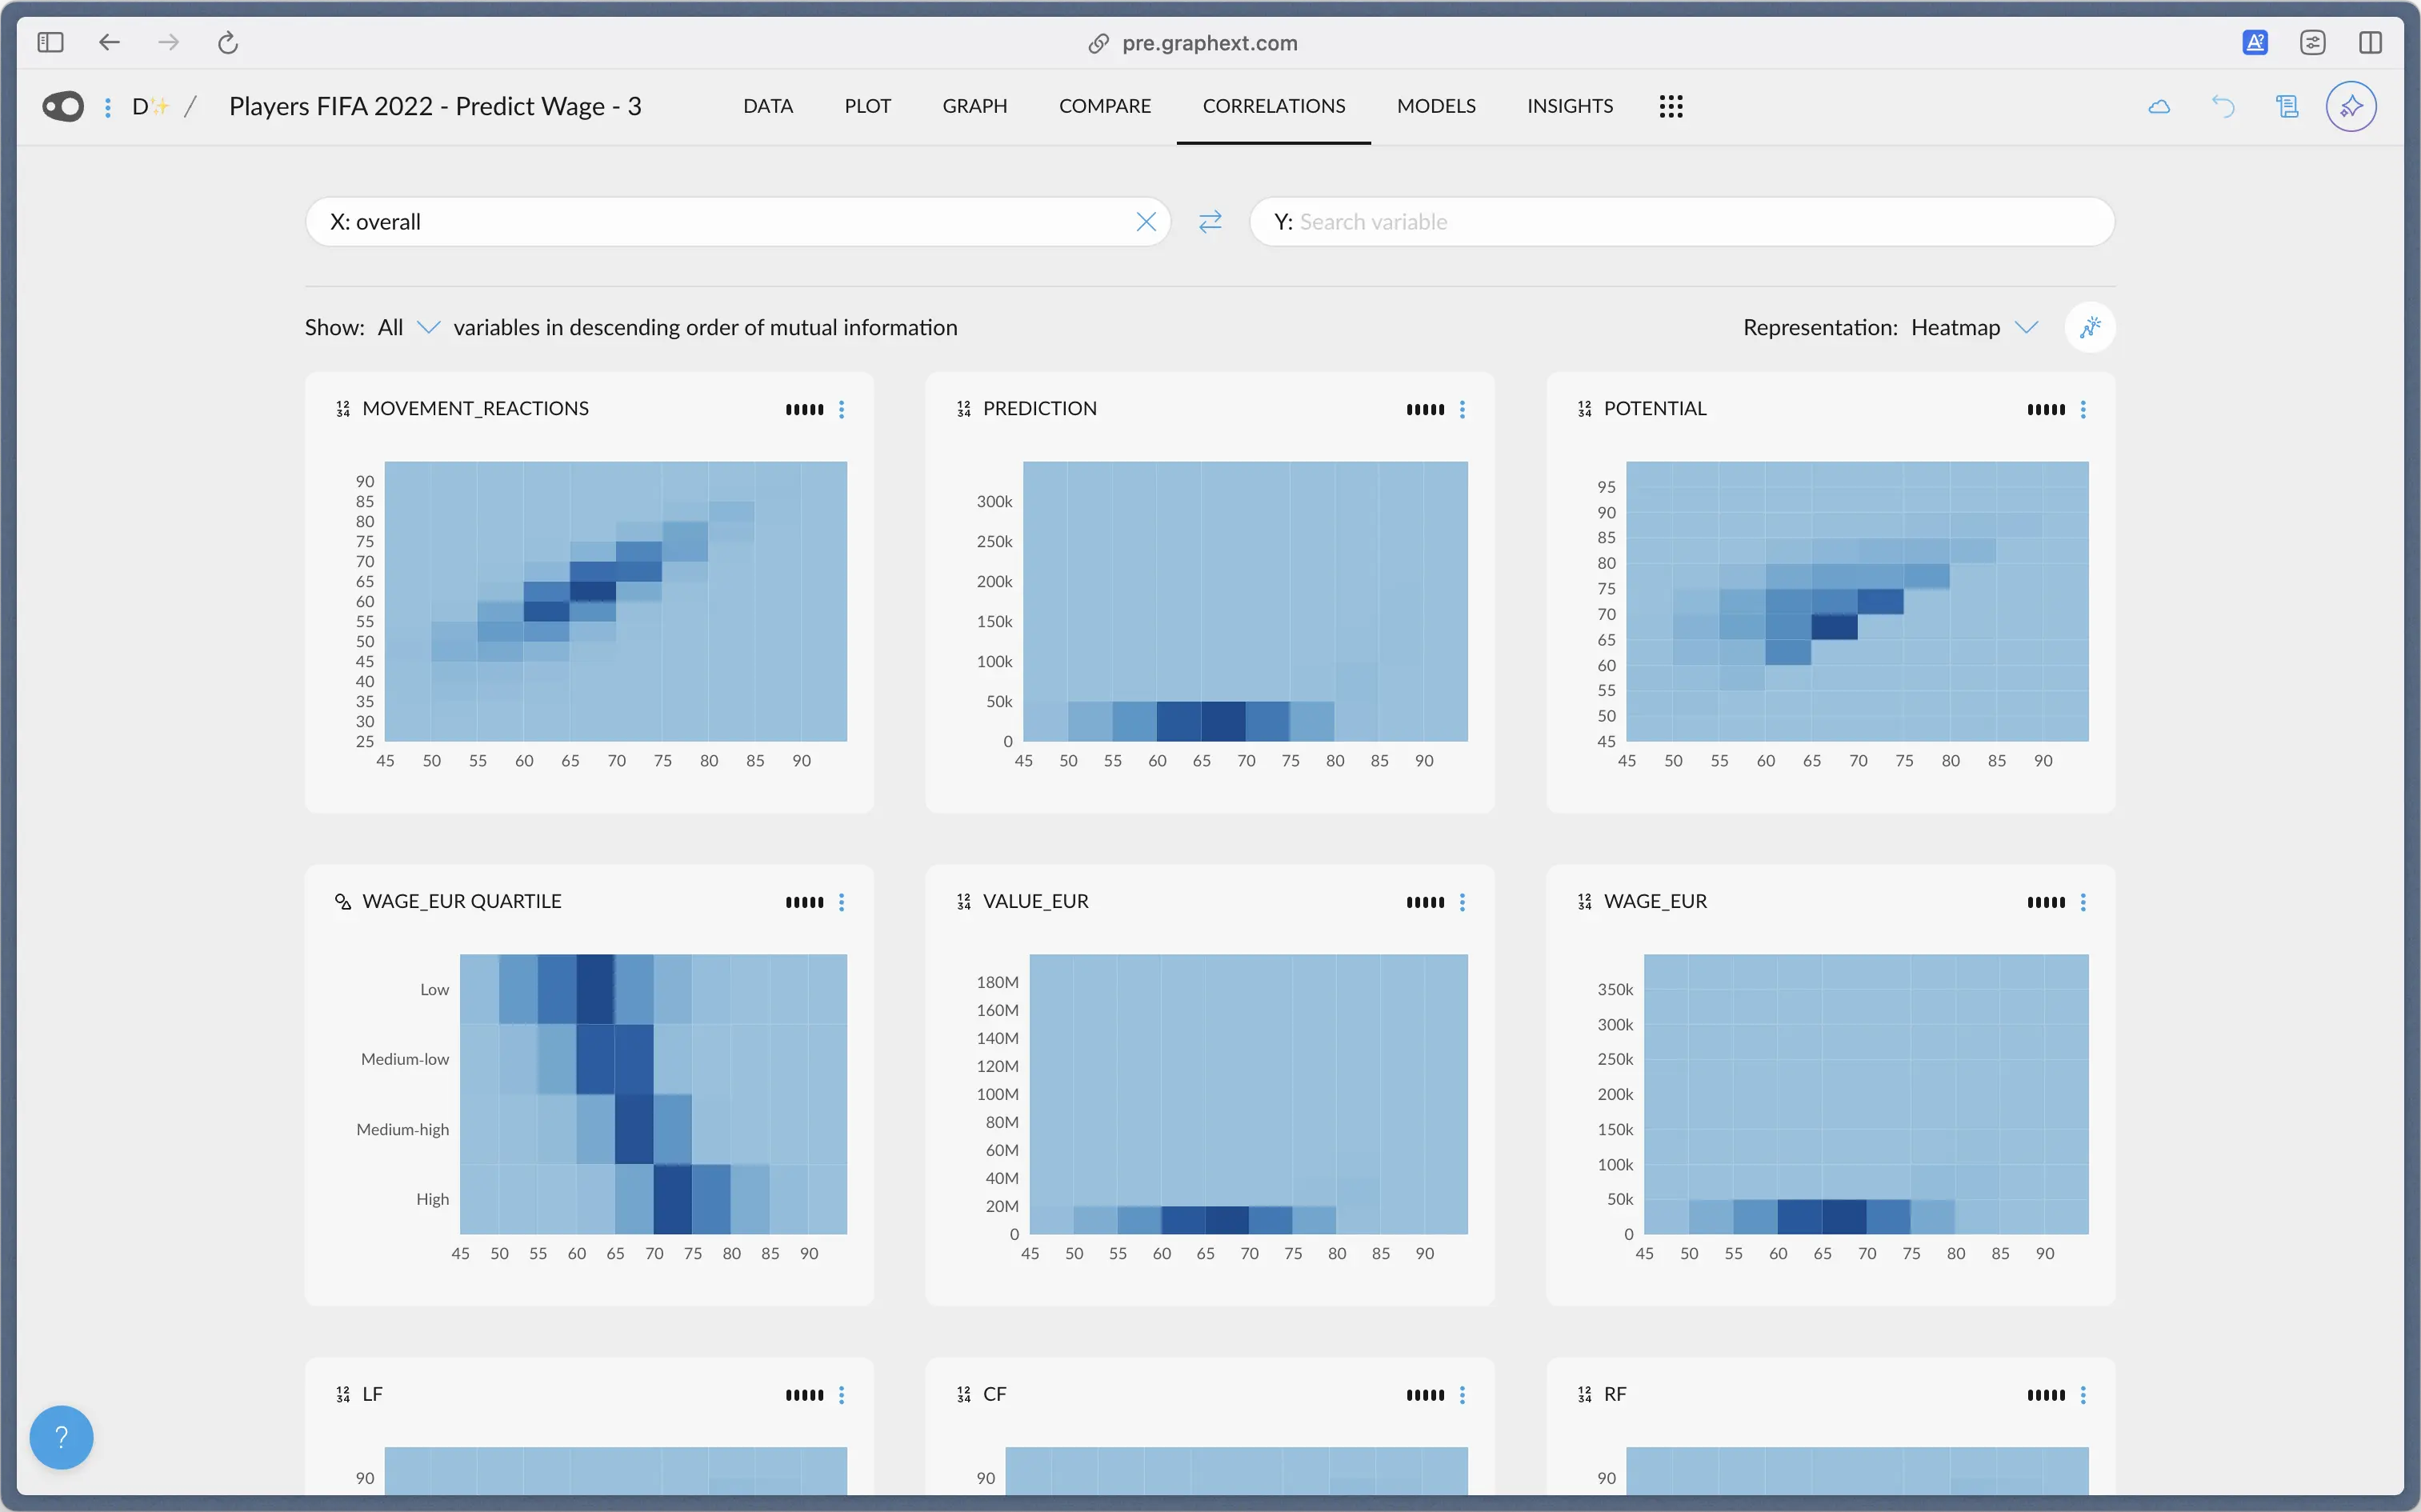
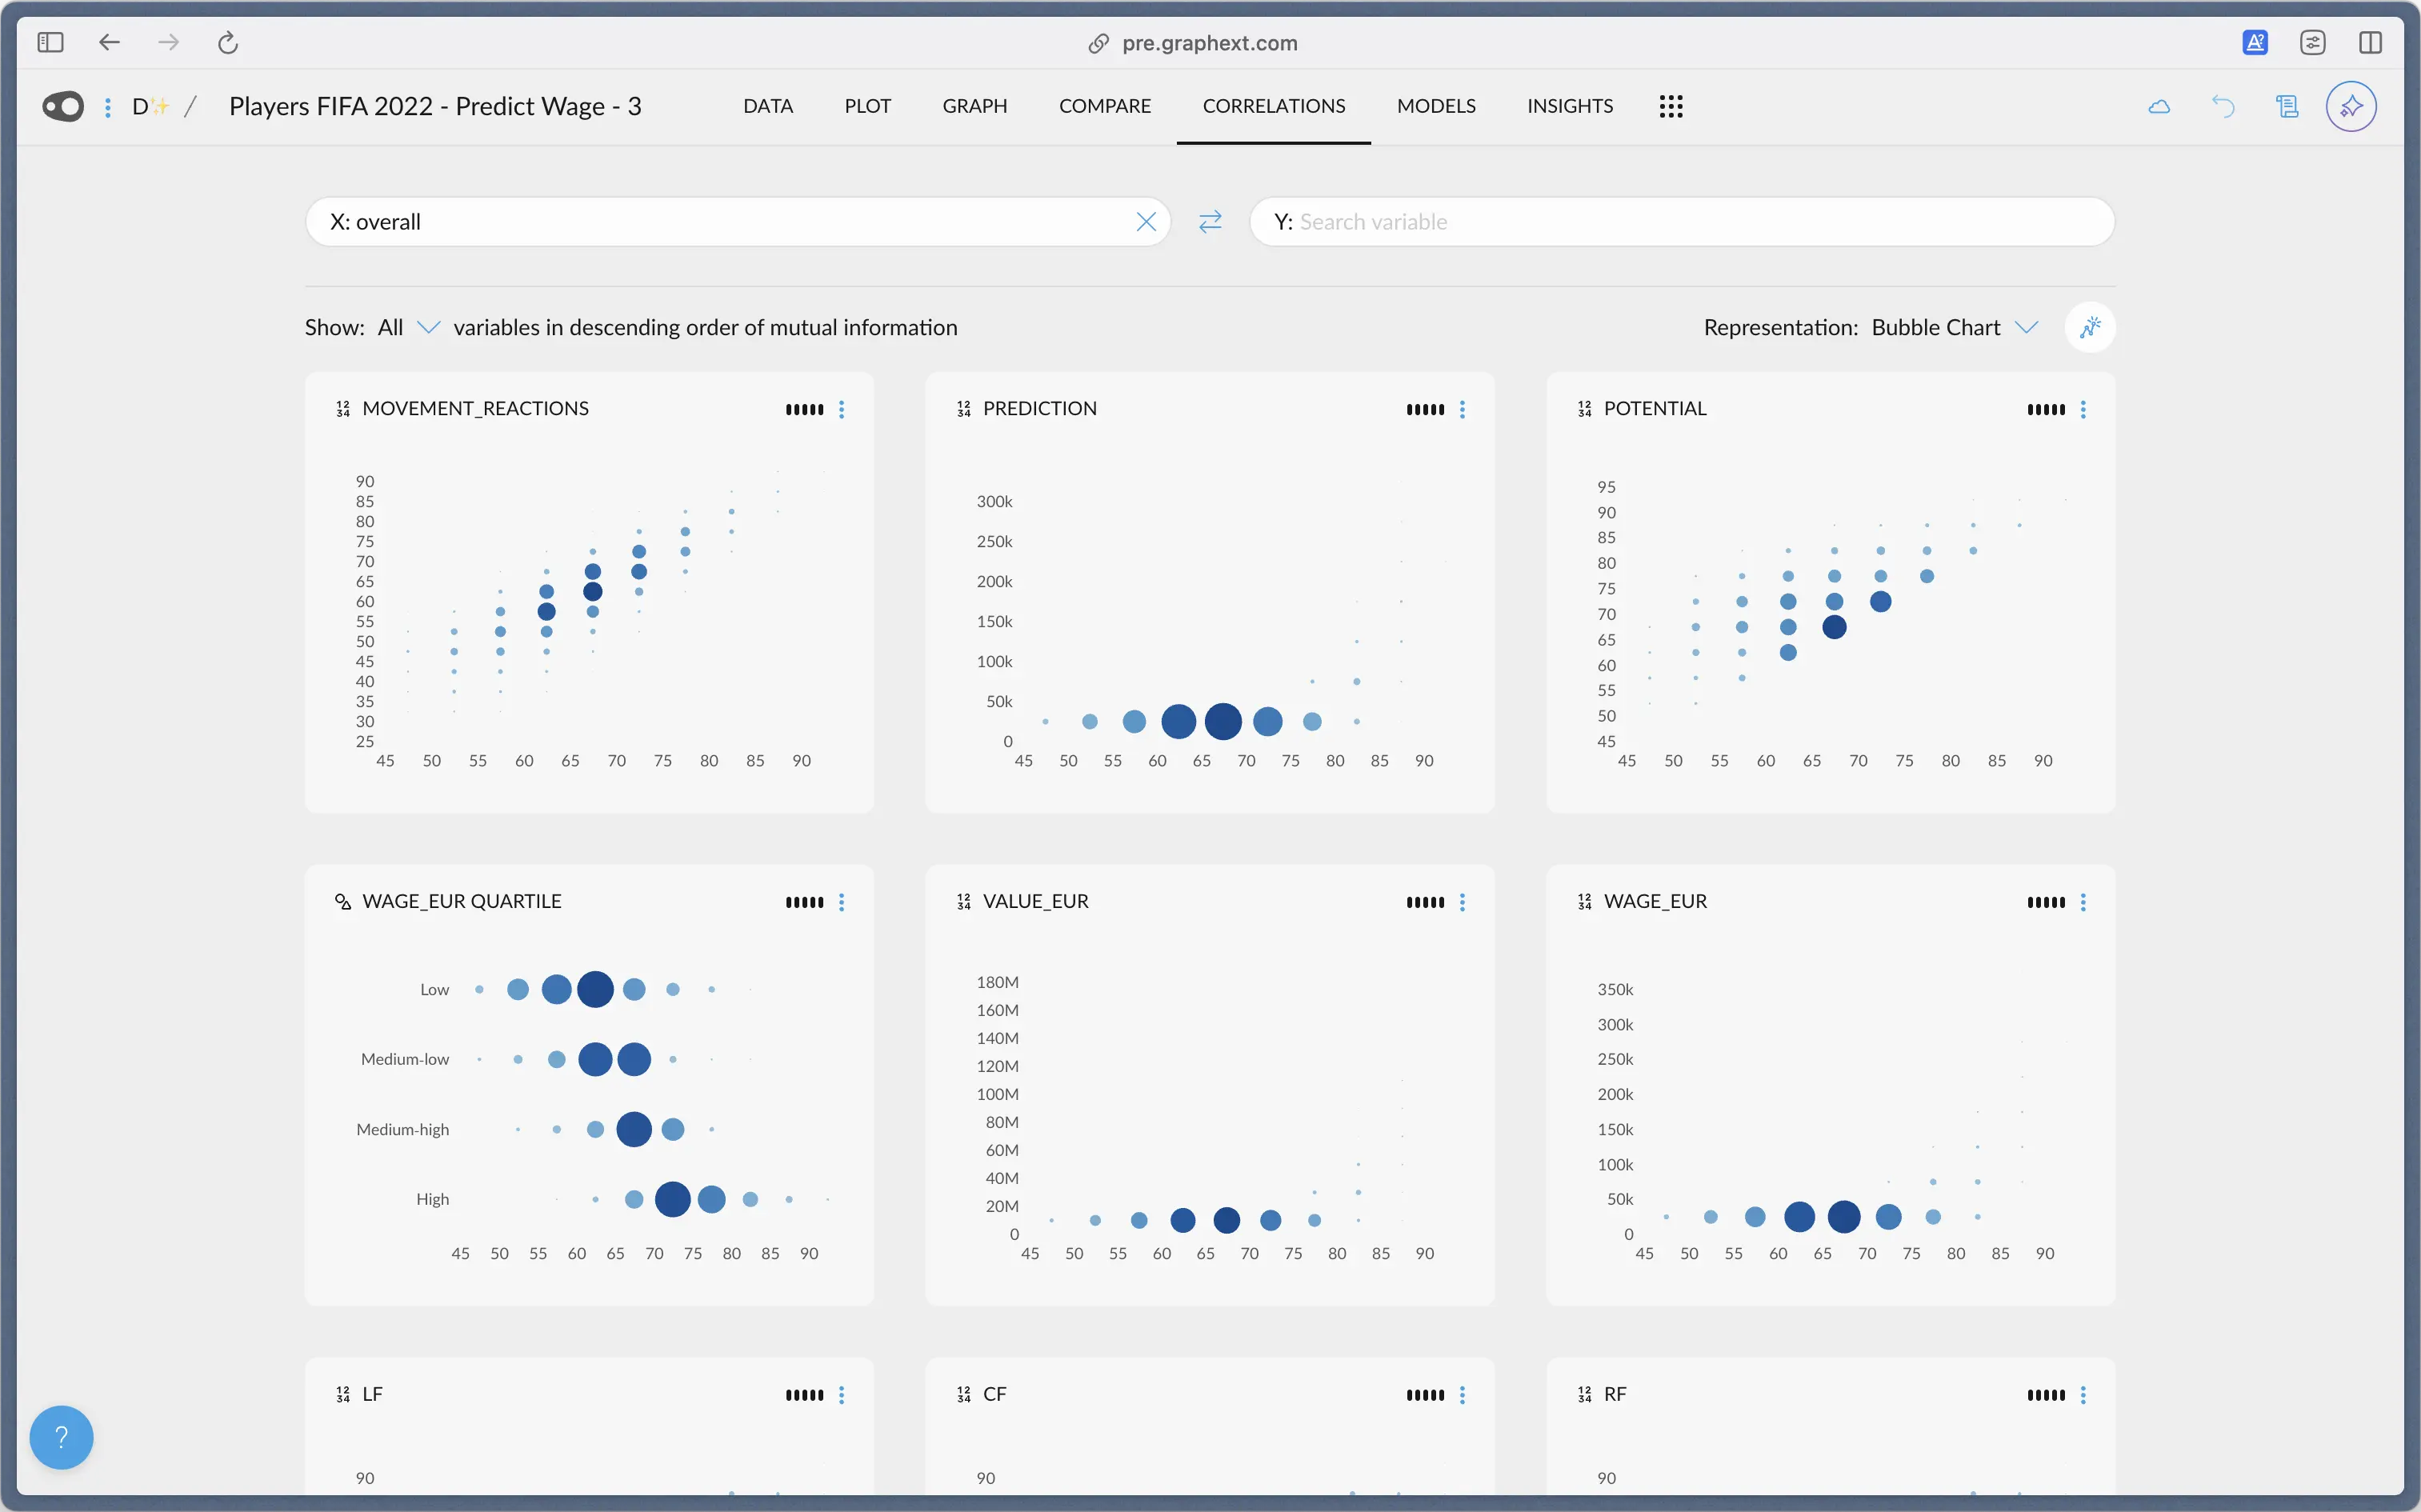
## Saving Correlations
There are multiple ways to save correlations as insights.
You may save a group of related correlations as an insight, or individual ones.
### Saving individual correlations
In order to save a correlation chart, navigate to the Correlations tab and click on the options, just as you would in the Data tab. Then, click “Save Insight”.
### Saving a group of correlations
In order to save a group of correlations, you can click on this button on the top right to save the first 5 charts visible at that point.
This view can be customized. You can display the correlations as bubble charts, heatmaps or in boxplot mode, by clicking on the dropdown next to the save multiple insights button.
 In order to change which variables appear, you can select the “Show All” dropdown, that will allow you to select any tags (link to tags) available.
Alternatively, you may select the “None” option, which will allow you to select any variables you want. Then you may save them individually or in groups of 5.
In order to change which variables appear, you can select the “Show All” dropdown, that will allow you to select any tags (link to tags) available.
Alternatively, you may select the “None” option, which will allow you to select any variables you want. Then you may save them individually or in groups of 5.
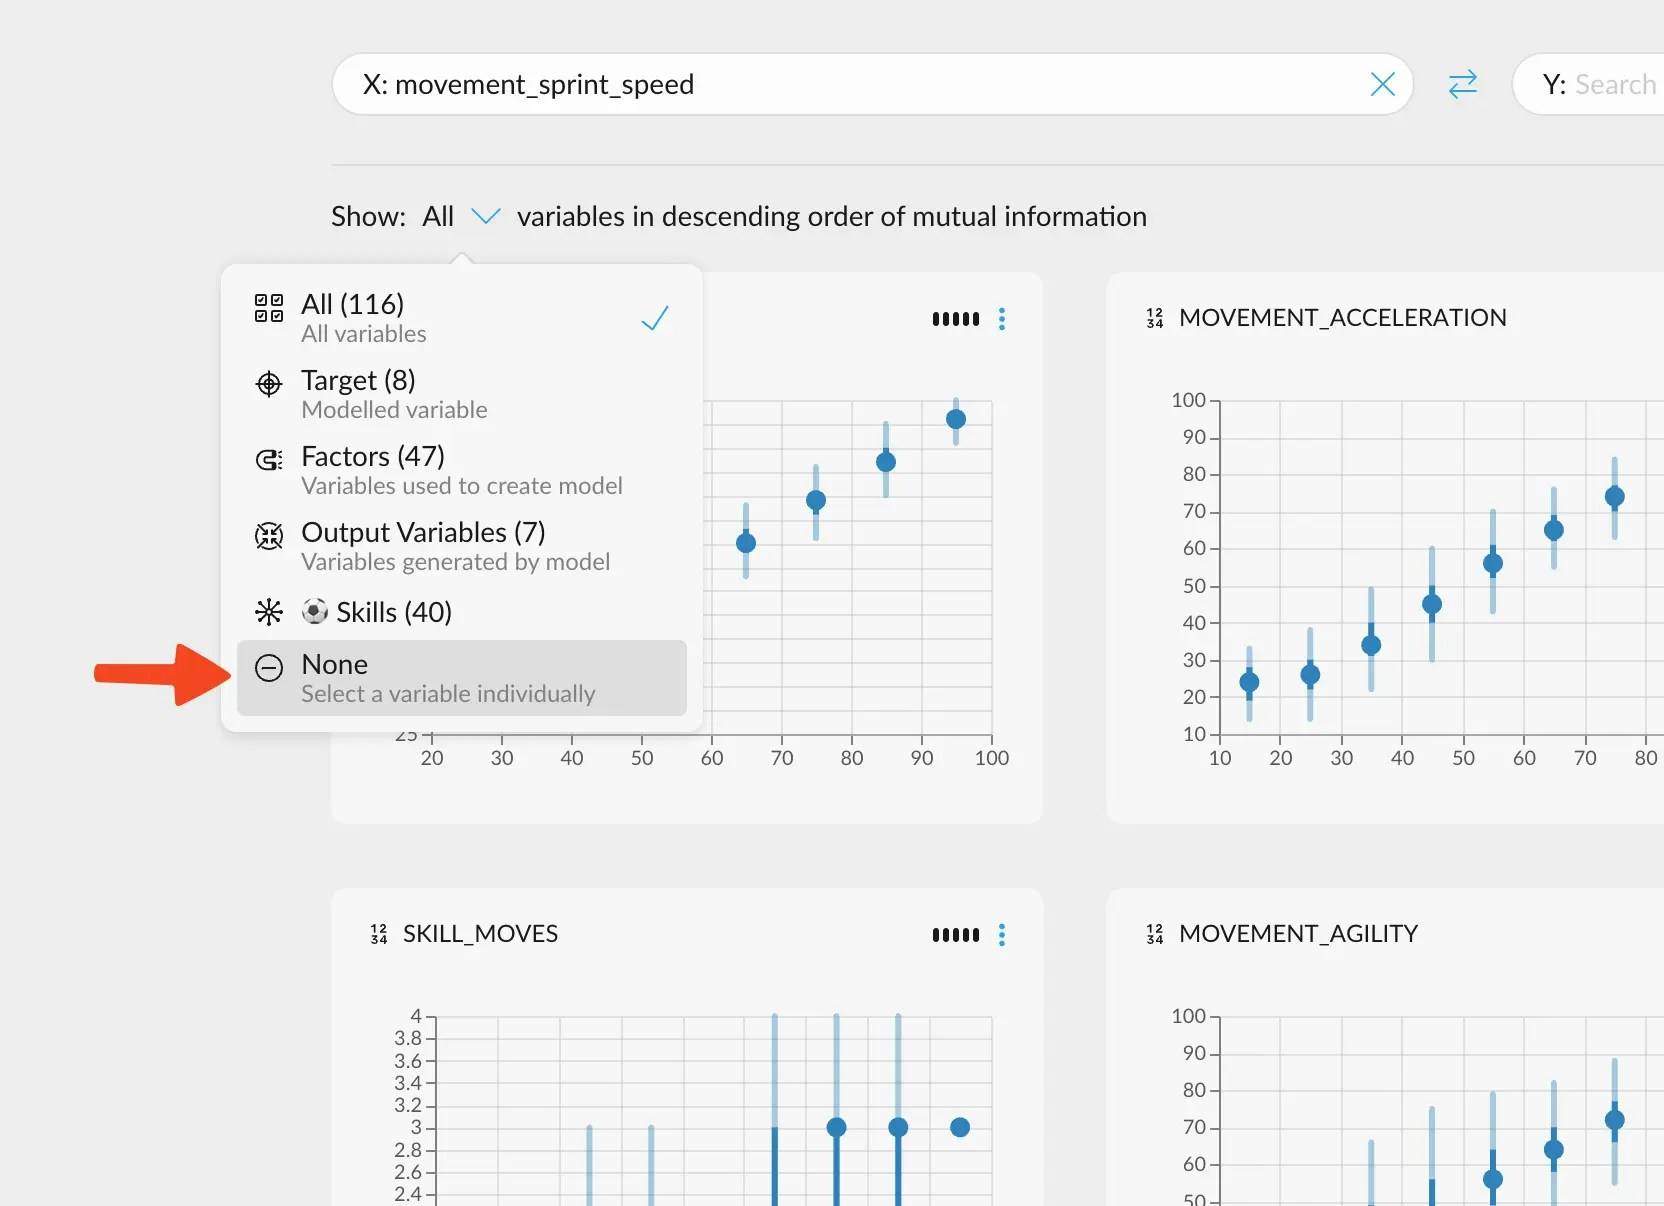 For this menu to appear, you need to have
[Tags](/concepts/graphext-concepts/tags) in your variables, since it's the
only way you can filter variables in this manner at the moment.
## Saving in Compare
To save an Insight from the Compare tab, you may proceed in the same way as with the Correlations tab.
## Accessing your insights
After creating your first insight, you’ll be able to access them from the Insights tab in the navigation bar up top.
For this menu to appear, you need to have
[Tags](/concepts/graphext-concepts/tags) in your variables, since it's the
only way you can filter variables in this manner at the moment.
## Saving in Compare
To save an Insight from the Compare tab, you may proceed in the same way as with the Correlations tab.
## Accessing your insights
After creating your first insight, you’ll be able to access them from the Insights tab in the navigation bar up top.
 All your insights will be presented here in chronological order of creation. You can press the play button in the lower
left corner to reproduce the chart. Any and all filters, color schemes and other settings present at the creation of the insight
will be reproduced.
On the lower right corner, you have options to edit and share the insight.
When editing an insight, you can add a title if there wasn't one, edit it, add descriptions, as well as adding or removing
the state of any cross filters that may be relevant.
You can also move all the little components and resize them. Also, when editing, in the lower left corner you may change the
insight's background theme to match whatever theme you have going on in your chart.
All your insights will be presented here in chronological order of creation. You can press the play button in the lower
left corner to reproduce the chart. Any and all filters, color schemes and other settings present at the creation of the insight
will be reproduced.
On the lower right corner, you have options to edit and share the insight.
When editing an insight, you can add a title if there wasn't one, edit it, add descriptions, as well as adding or removing
the state of any cross filters that may be relevant.
You can also move all the little components and resize them. Also, when editing, in the lower left corner you may change the
insight's background theme to match whatever theme you have going on in your chart.