> ## Documentation Index
> Fetch the complete documentation index at: https://docs.graphext.com/llms.txt
> Use this file to discover all available pages before exploring further.
# Export plots & charts
> Get publish ready charts in minutes
There are several ways to export charts in Graphext. Almost every chart
you can see throughout the application can be exported.
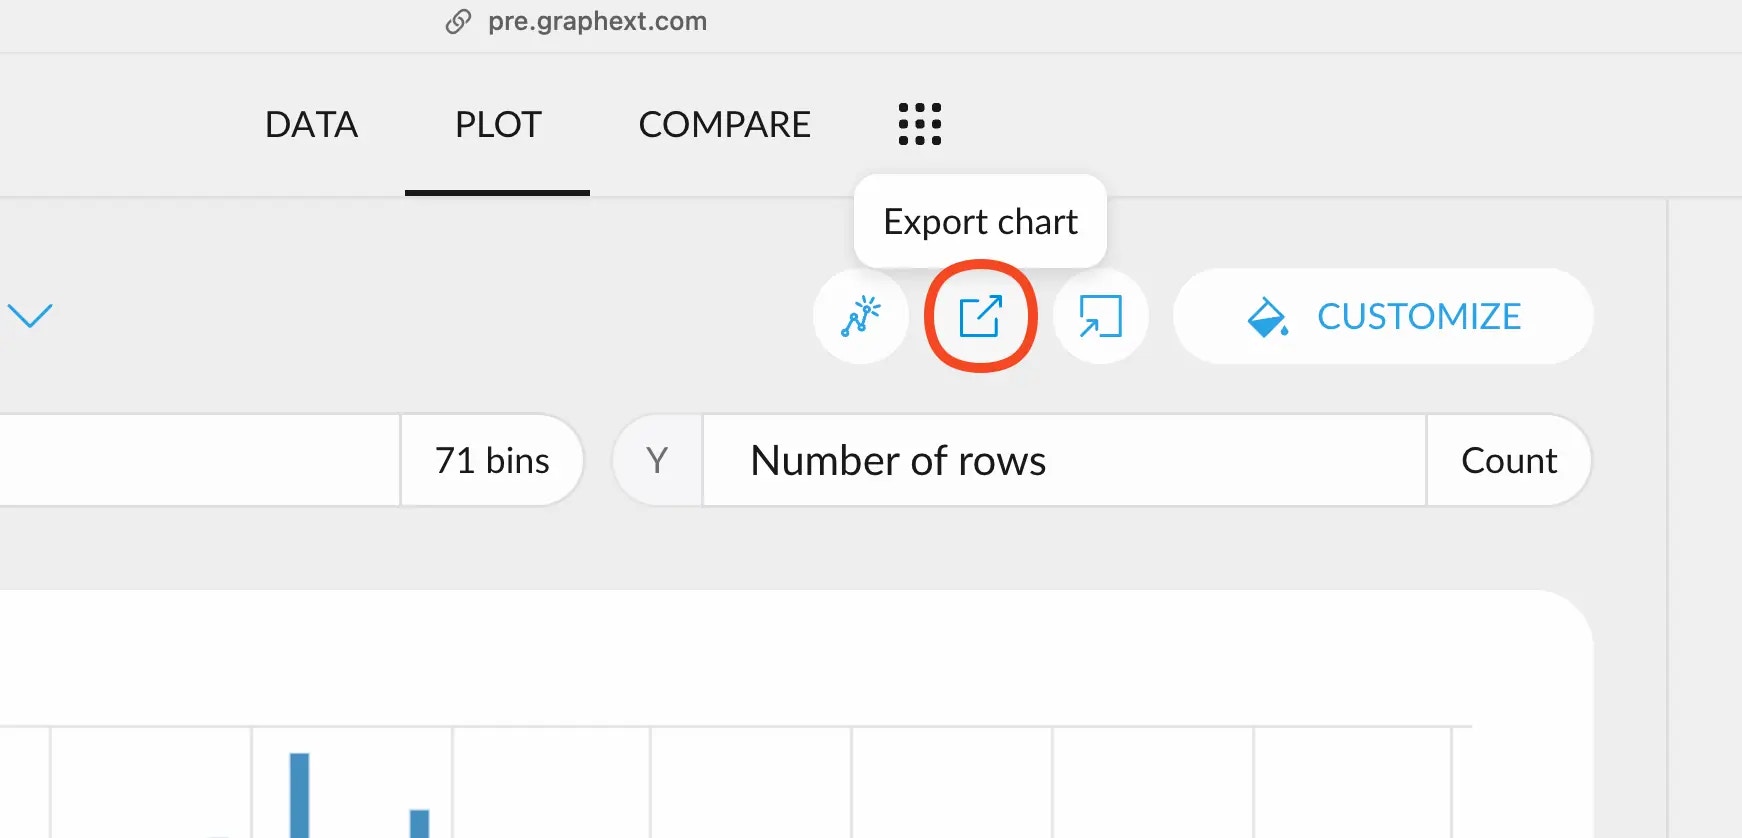
## Saving charts from Plot
After you've [created your plot](/documentation/data-visualization/create-a-plot), you can save it to your computer right
from the plot menu. Simply click on the "Export Chart" button at the top
and continue.
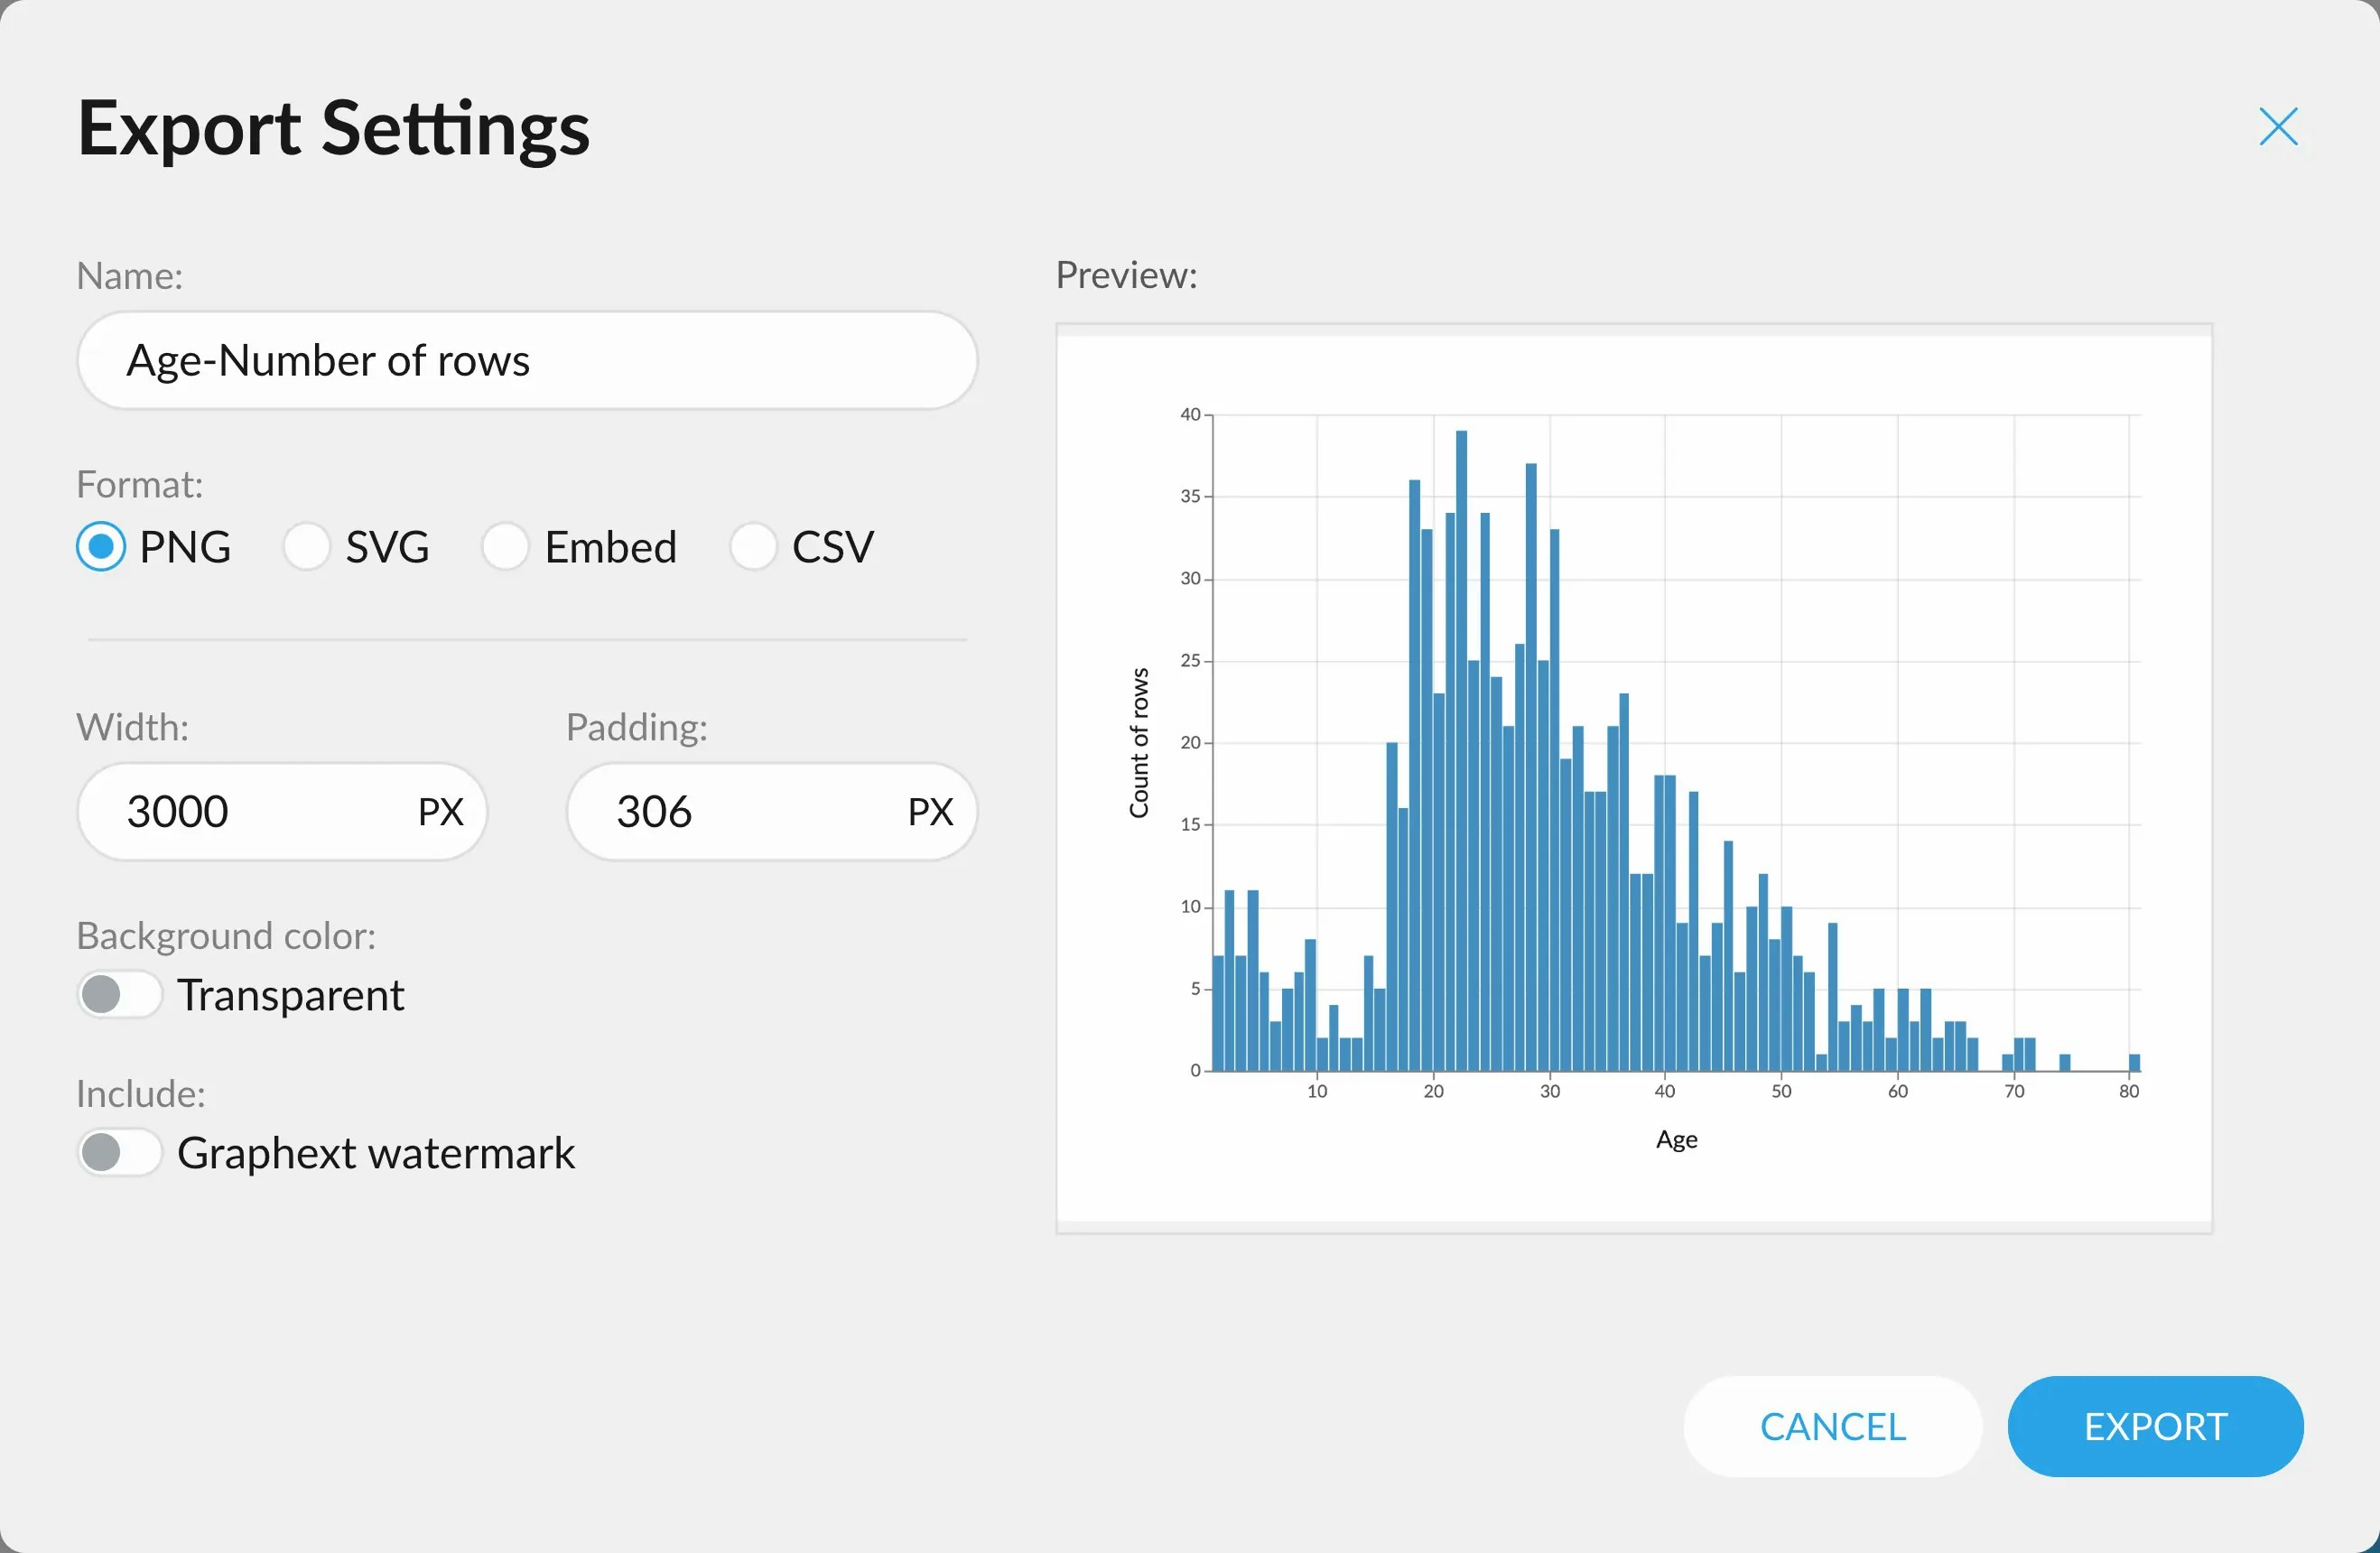
 This will present a menu from which you can select the format, adjust the size
of the final chart, toggle transparency (if supported) and including our watermark
in the final image.
This will present a menu from which you can select the format, adjust the size
of the final chart, toggle transparency (if supported) and including our watermark
in the final image.
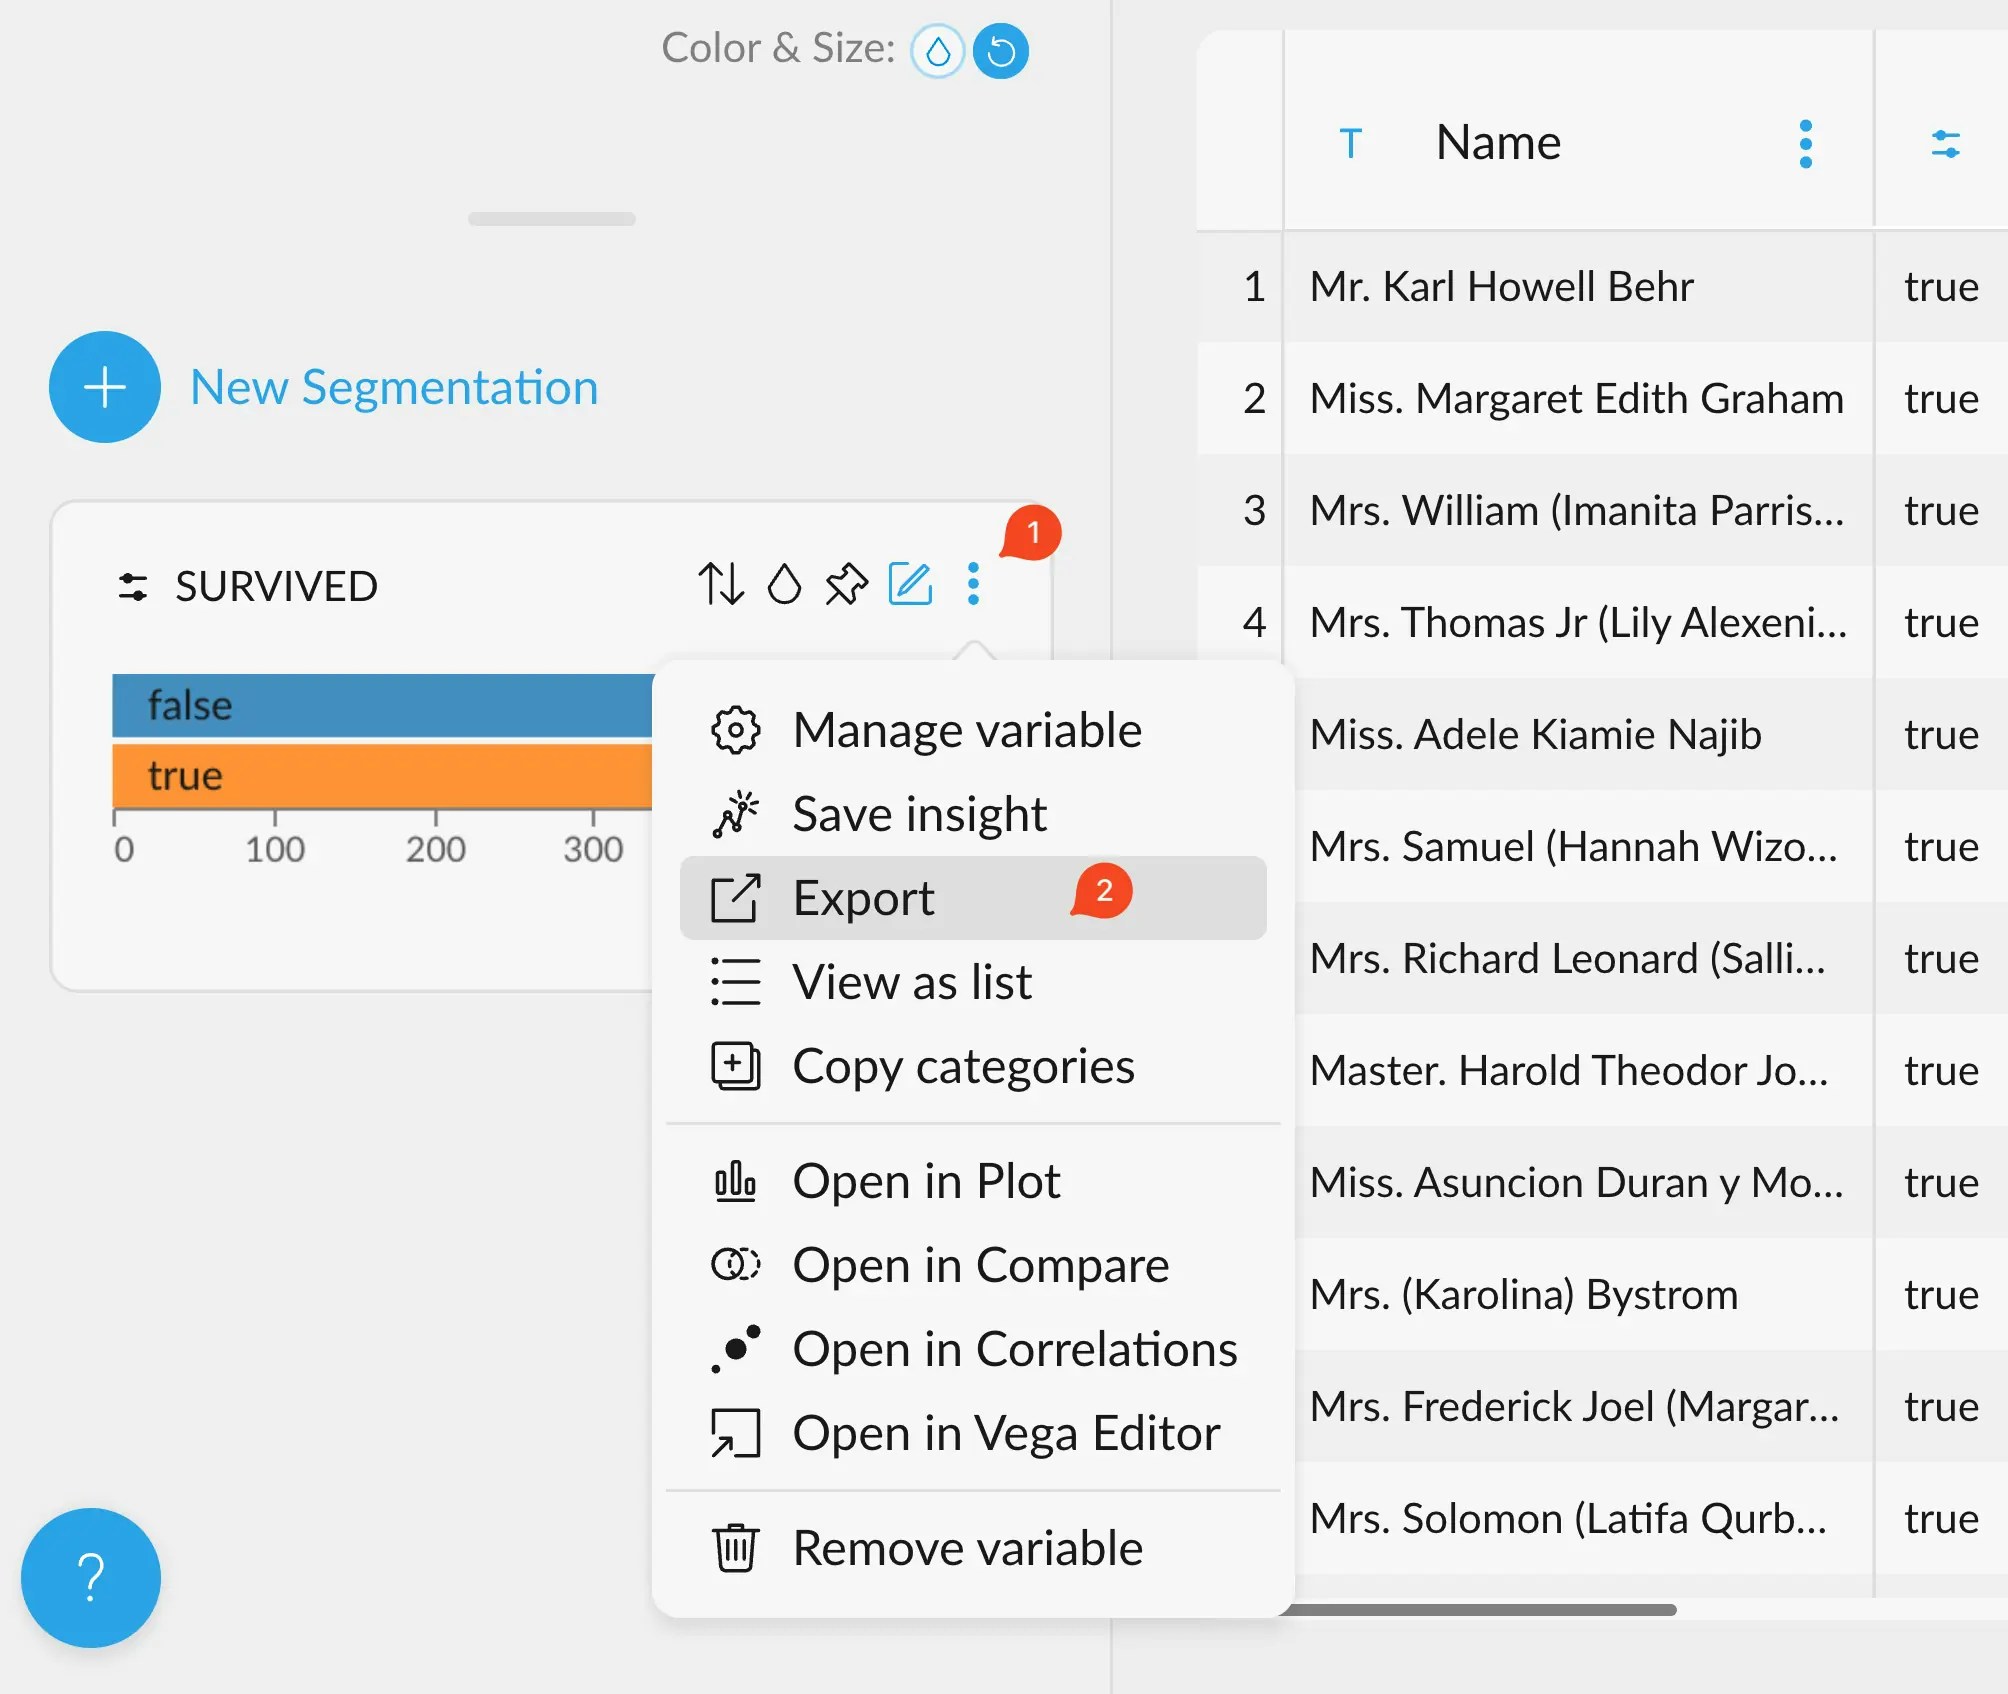
 ## Saving charts from the interface
In case it is convenient, all the little charts you can see to the sides in Data
and Plot can also be exported!
## Saving charts from the interface
In case it is convenient, all the little charts you can see to the sides in Data
and Plot can also be exported!
 This will bring you to the same menu previously mentioned.
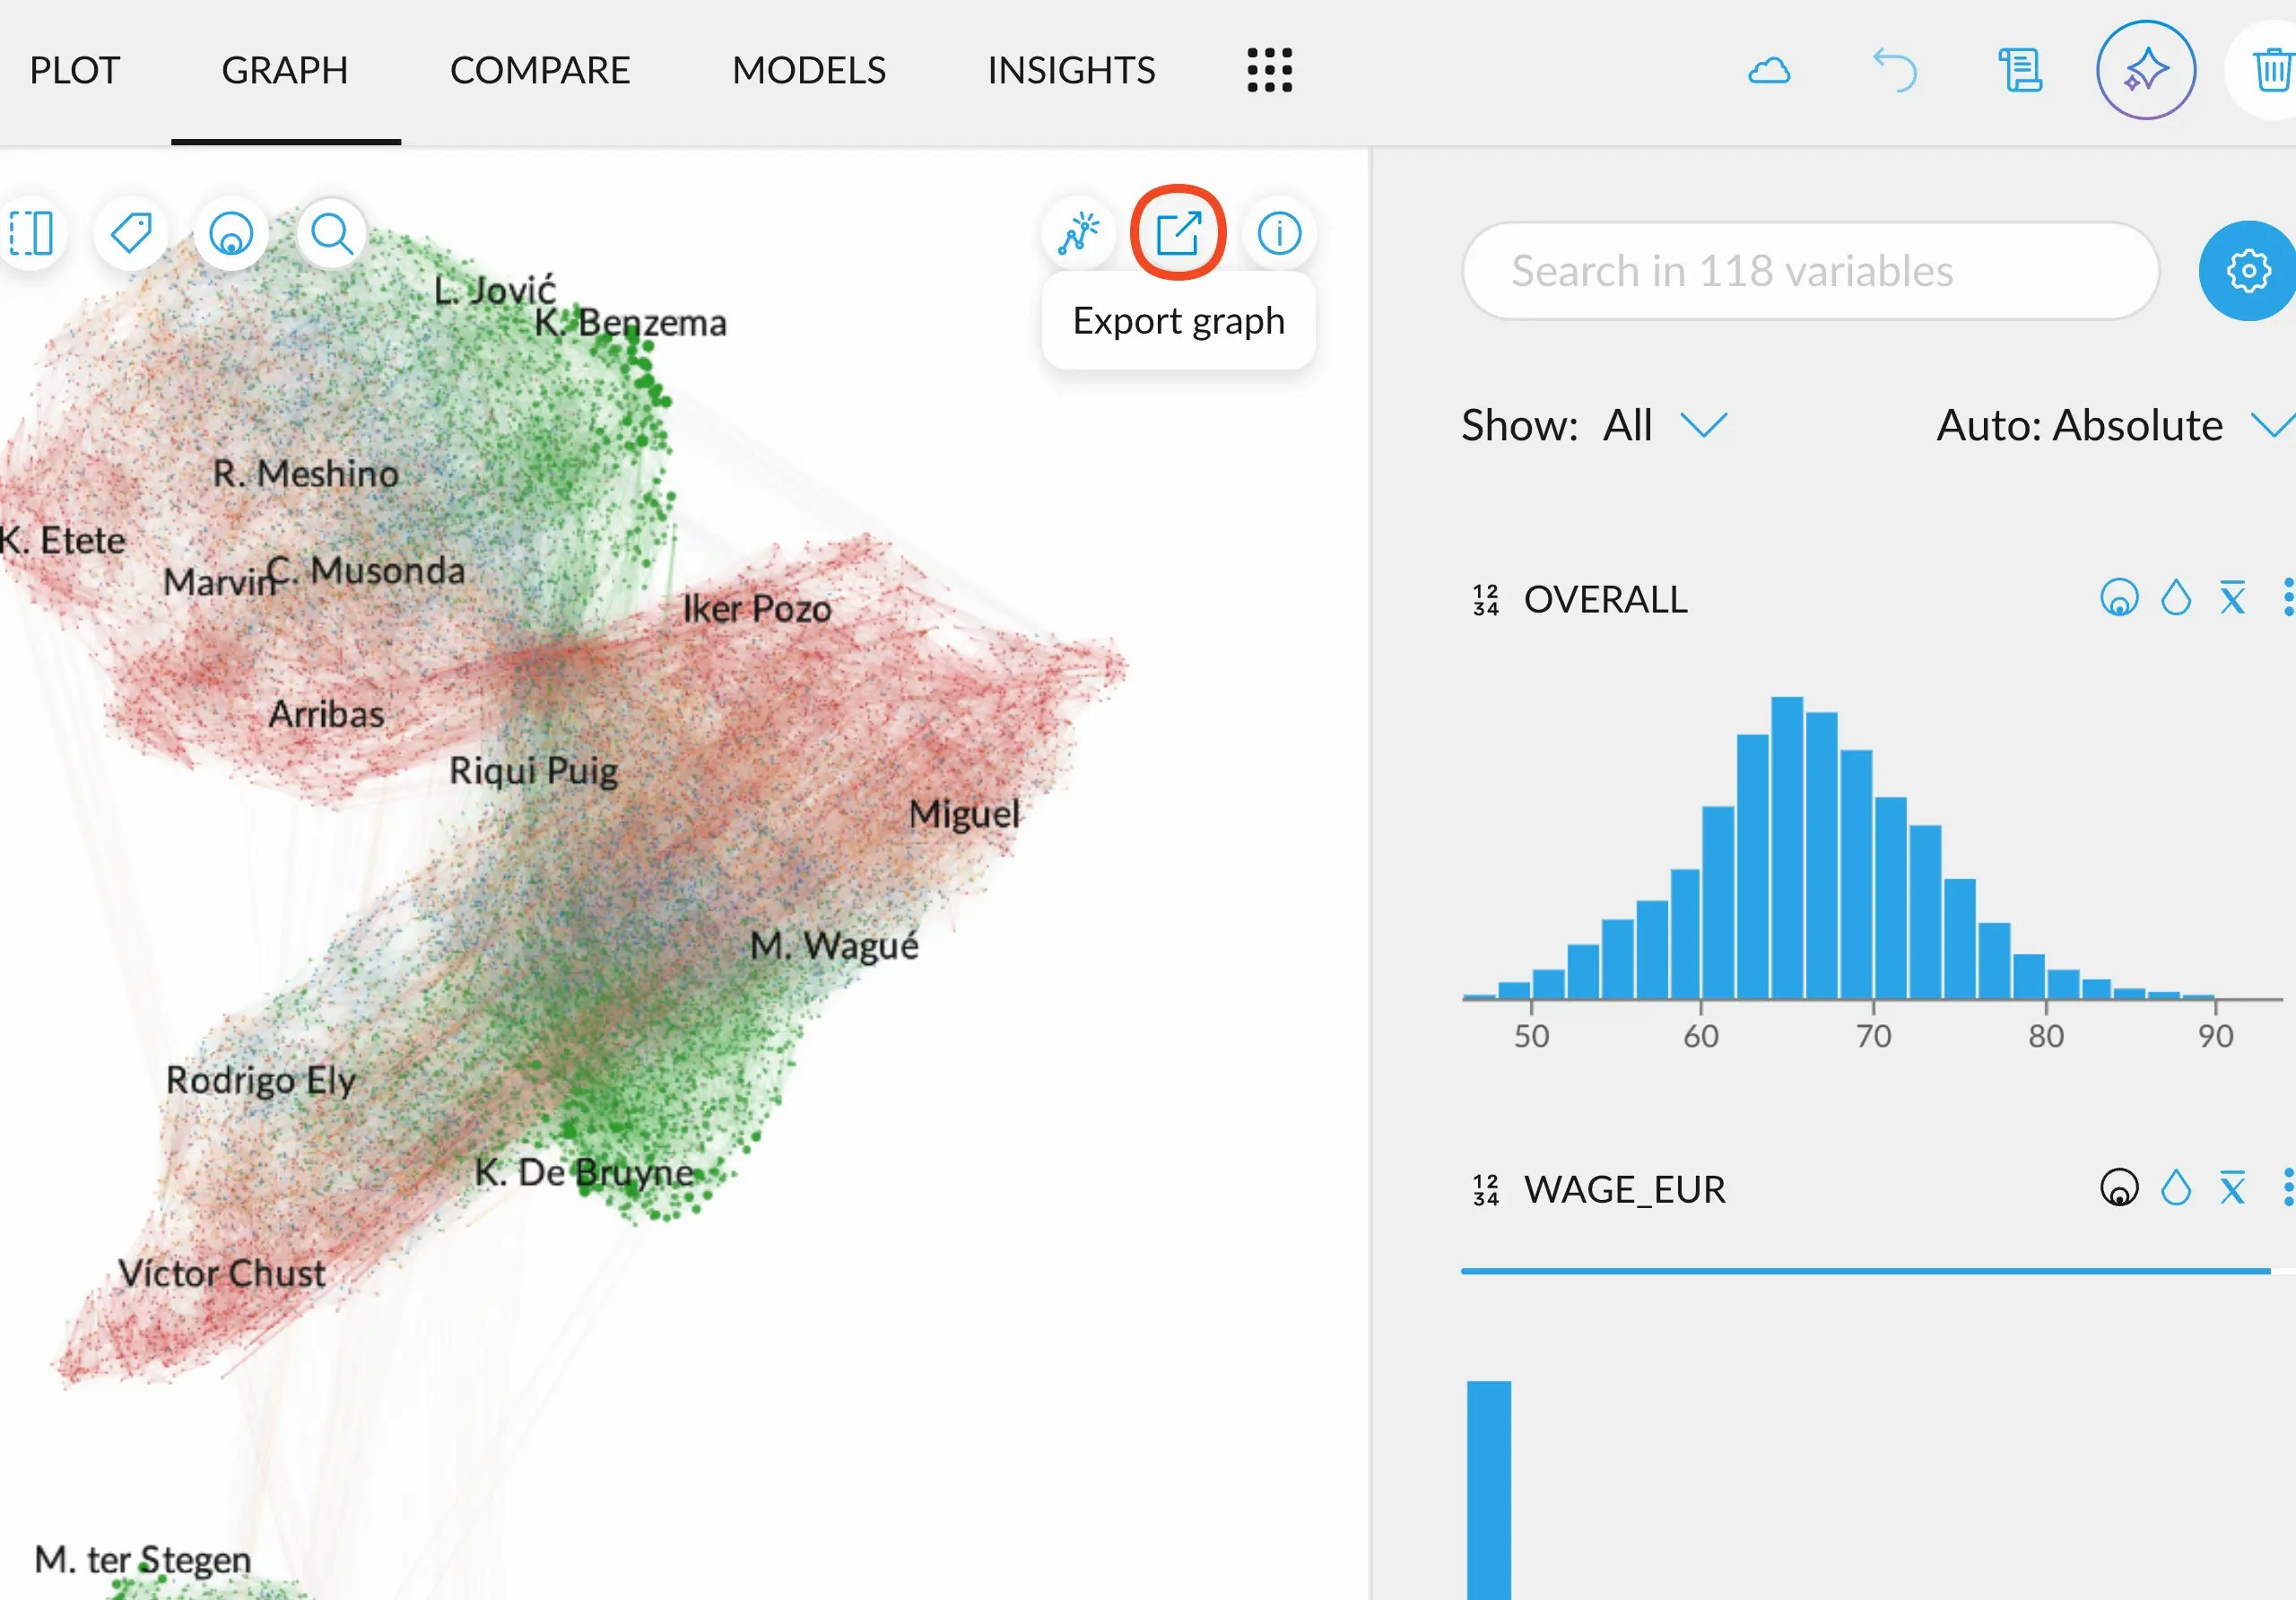
## Export the Graph
Additionally, you can also export the Graph view just like any
other visualization in Graphext. Go to the Graph tab after creating
a cluster of your data and hit the "Export graph" button.
This will bring you to the same menu previously mentioned.
This will bring you to the same menu previously mentioned.
## Export the Graph
Additionally, you can also export the Graph view just like any
other visualization in Graphext. Go to the Graph tab after creating
a cluster of your data and hit the "Export graph" button.
This will bring you to the same menu previously mentioned.
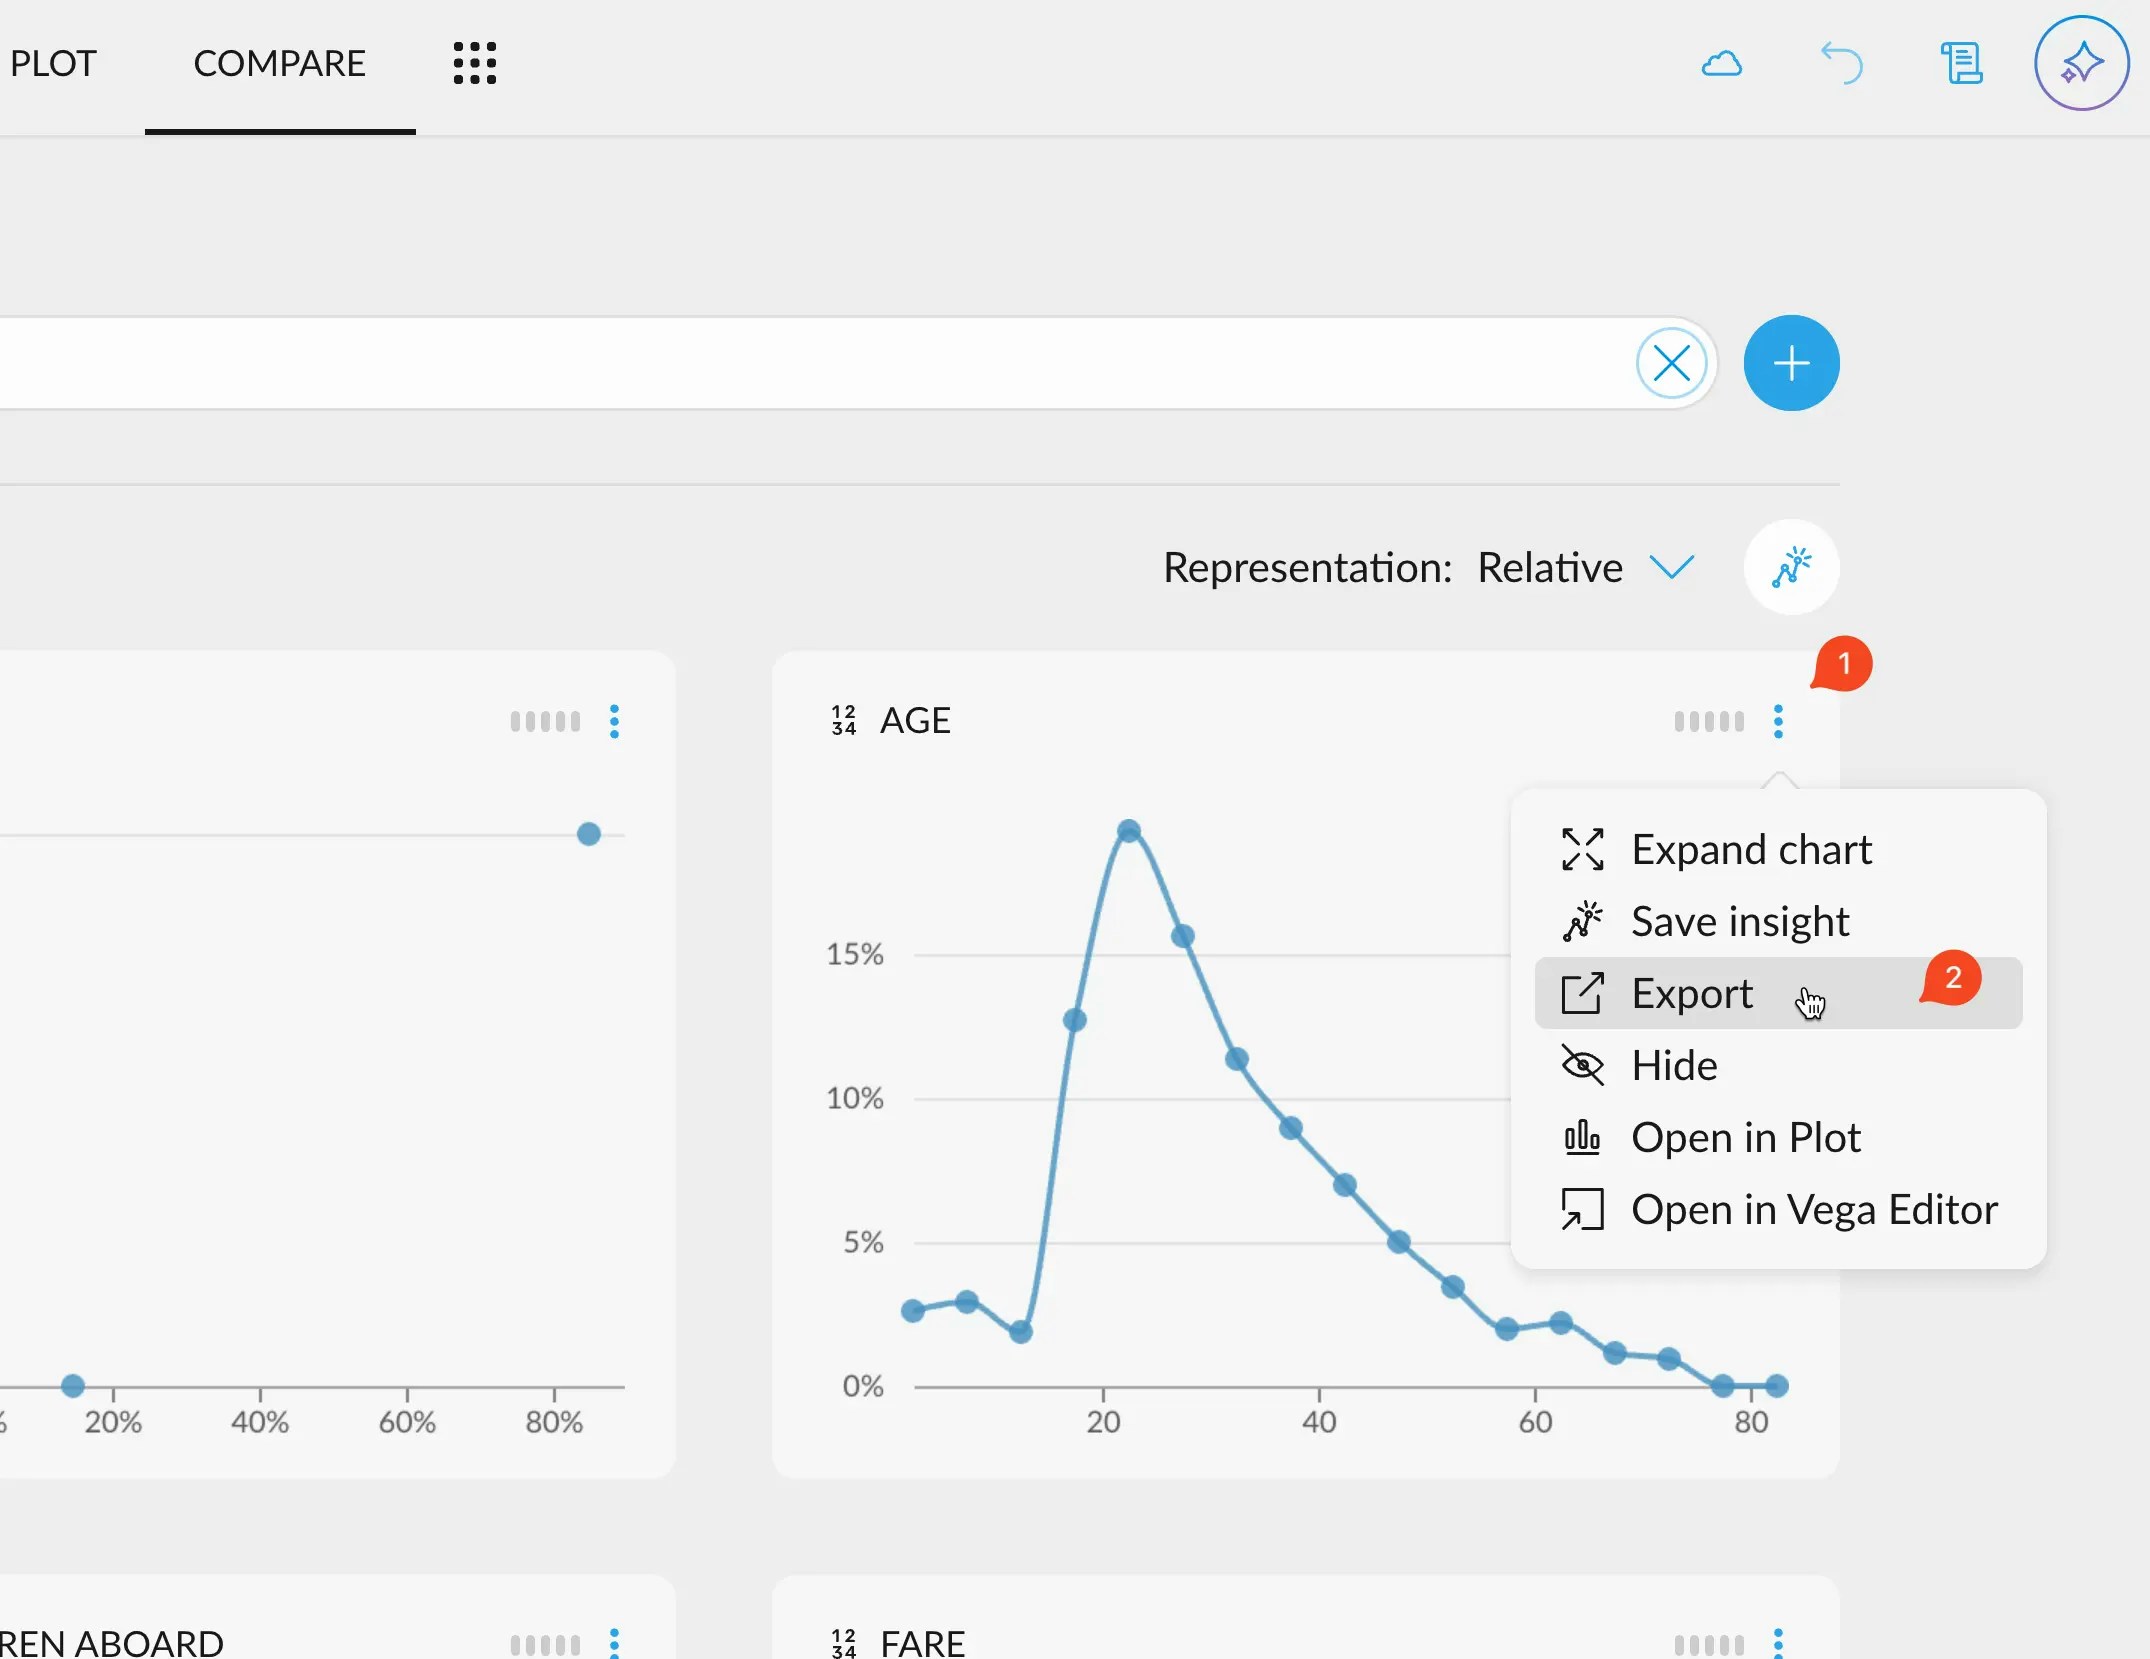
 ## Saving charts from Compare
In the same fashion as everywhere else, you can export any chart you find in the
Compare tab.
This will bring you to the same menu previously mentioned, albeit a bit more limited.
## Saving charts from Compare
In the same fashion as everywhere else, you can export any chart you find in the
Compare tab.
This will bring you to the same menu previously mentioned, albeit a bit more limited.
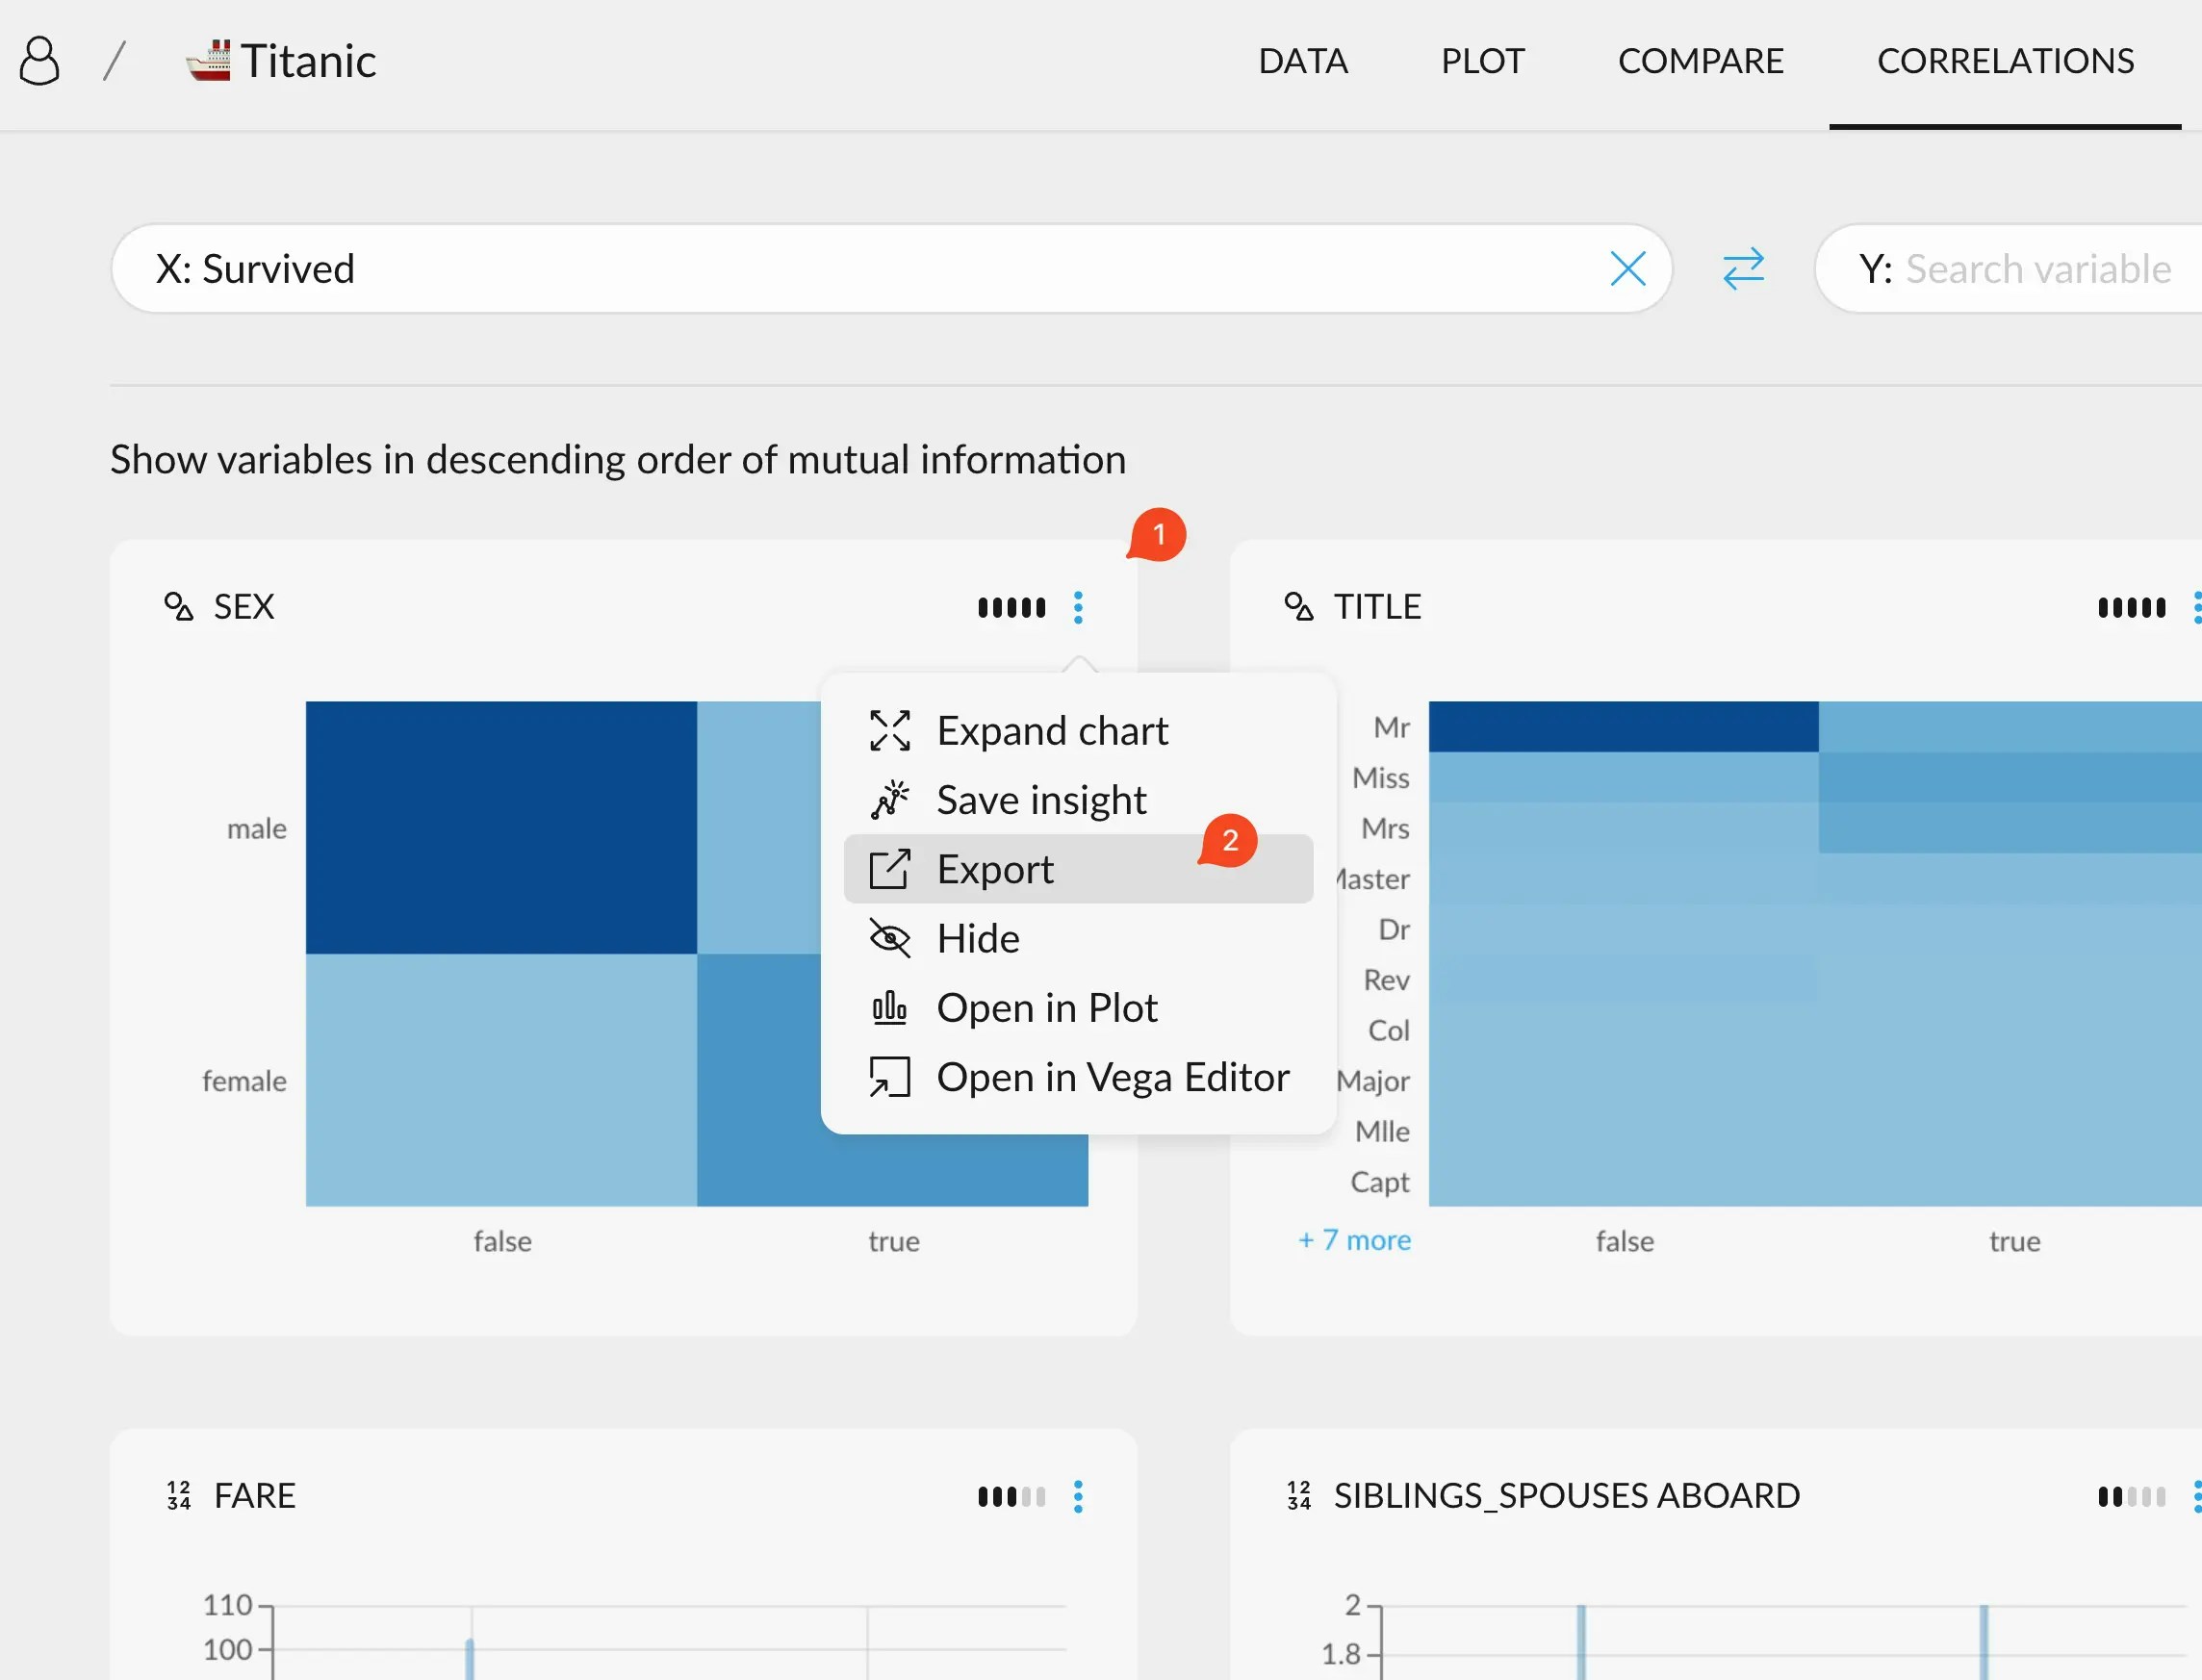
 ## Saving charts from Correlations
In the same fashion as everywhere else, you can export any chart you find in the
Correlations tab.
This will bring you to the same menu previously mentioned, albeit a bit more limited.
## Saving charts from Correlations
In the same fashion as everywhere else, you can export any chart you find in the
Correlations tab.
This will bring you to the same menu previously mentioned, albeit a bit more limited.