> ## Documentation Index
> Fetch the complete documentation index at: https://docs.graphext.com/llms.txt
> Use this file to discover all available pages before exploring further.
# Advanced data selection
> Rediscover data exploration interactively
***
## Exploring with cross filters
[Cross filters](/concepts/graphext-concepts/cross-filters) are one of the most powerful tools Graphext offers. They are natural to use, as they
show the distribution of your variables, but enable exploration on different combinations of values,
making the whole interface reactive.
For example, in this dataset holding transactions from an e-commerce, we can filter those transactions made
between 2020 and 2022:
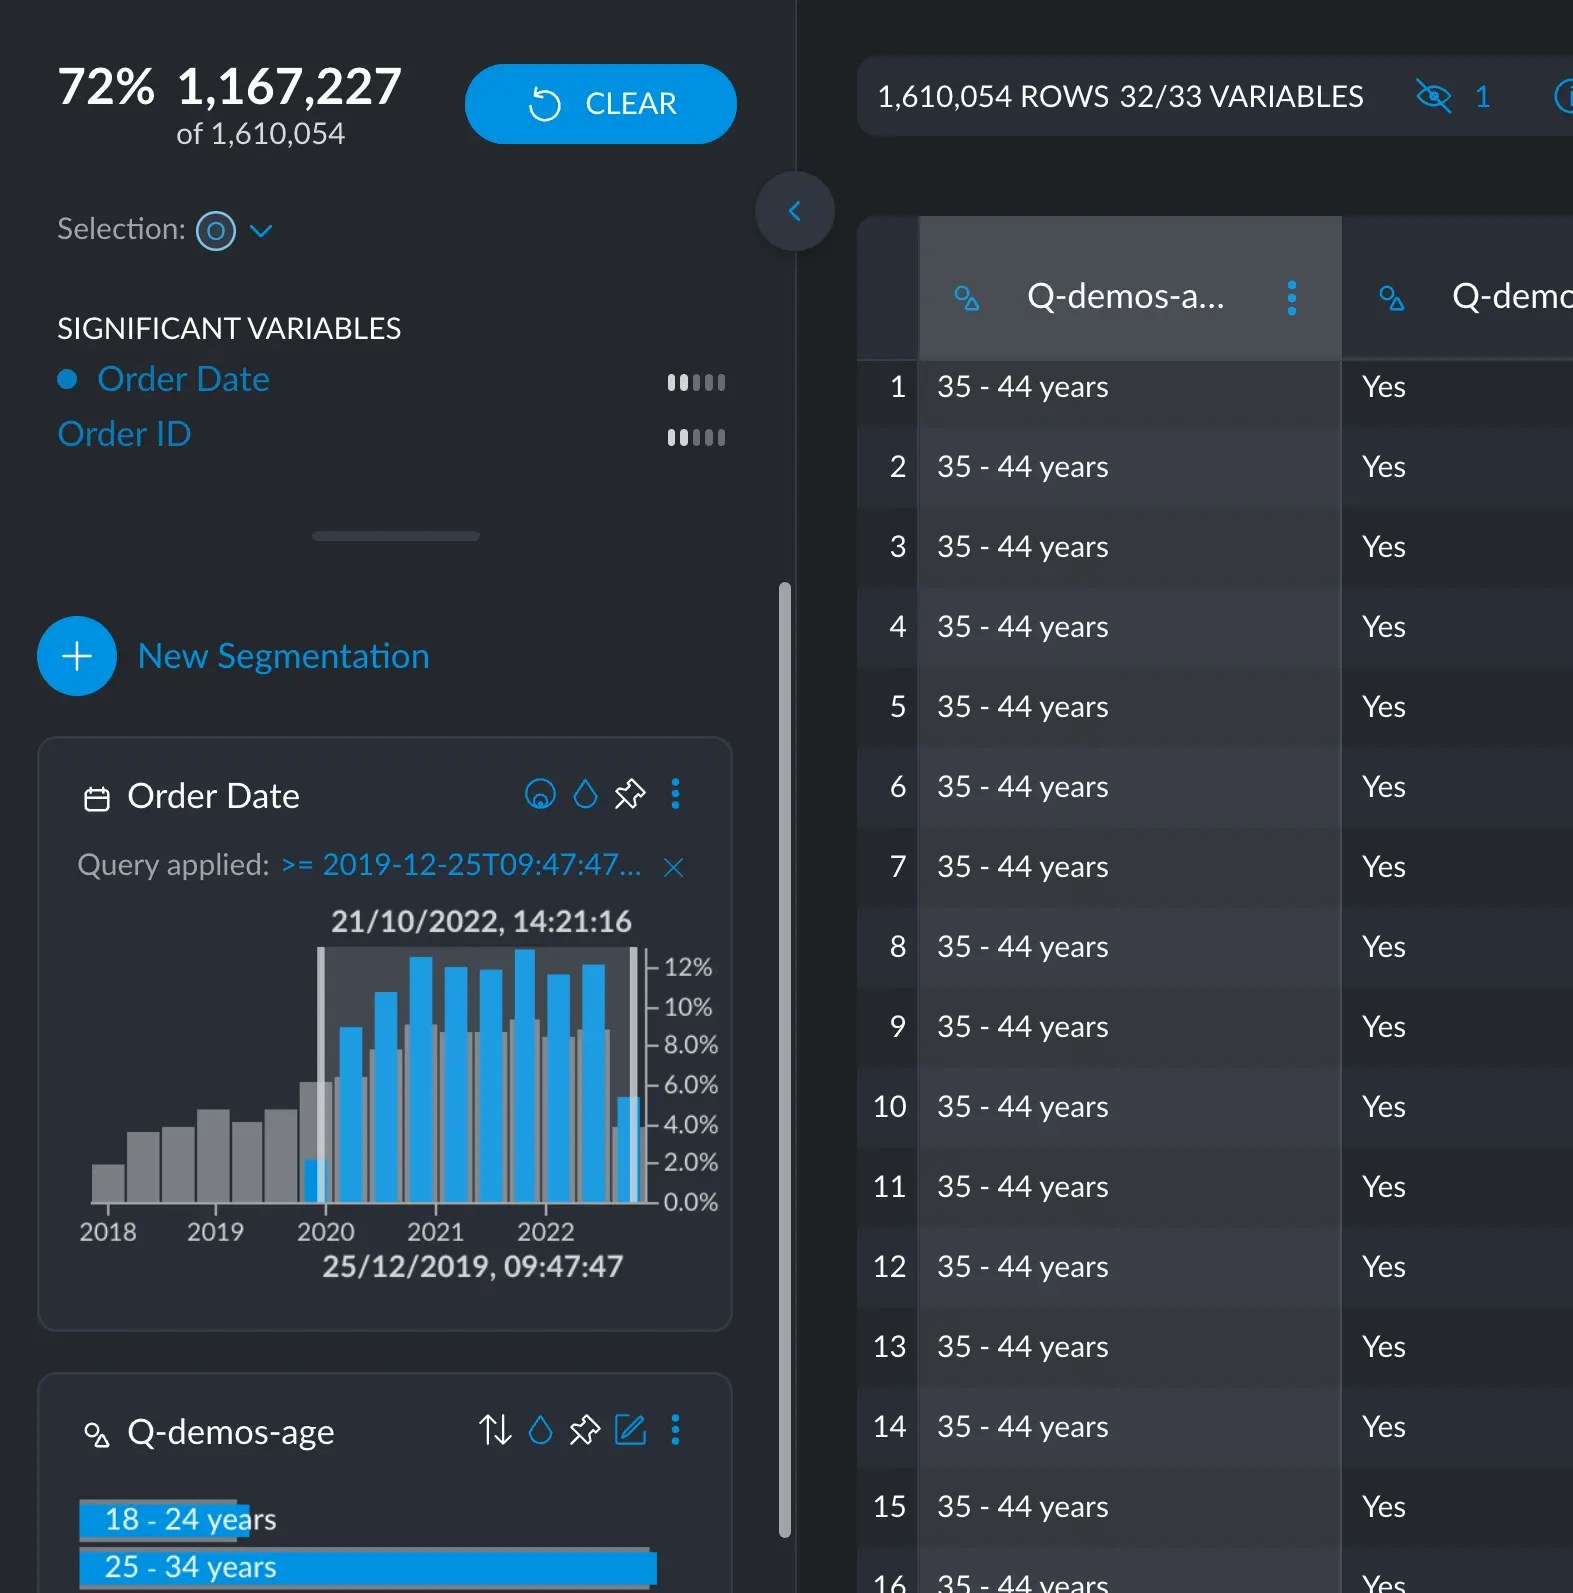 which leaves us with 72% of the data, 1.1M rows out of 1.6M we have in total.
Notice the relative scale on the right, spanning from 0 to 12% (really it's more like \~13%). That is now telling us how
much of our data lies on each of the bars (called bins).
This (or any) selection affects every other cross filter. This is what makes them so powerful: they all behave like
one single system informing of the different distributions of your variables.
which leaves us with 72% of the data, 1.1M rows out of 1.6M we have in total.
Notice the relative scale on the right, spanning from 0 to 12% (really it's more like \~13%). That is now telling us how
much of our data lies on each of the bars (called bins).
This (or any) selection affects every other cross filter. This is what makes them so powerful: they all behave like
one single system informing of the different distributions of your variables.
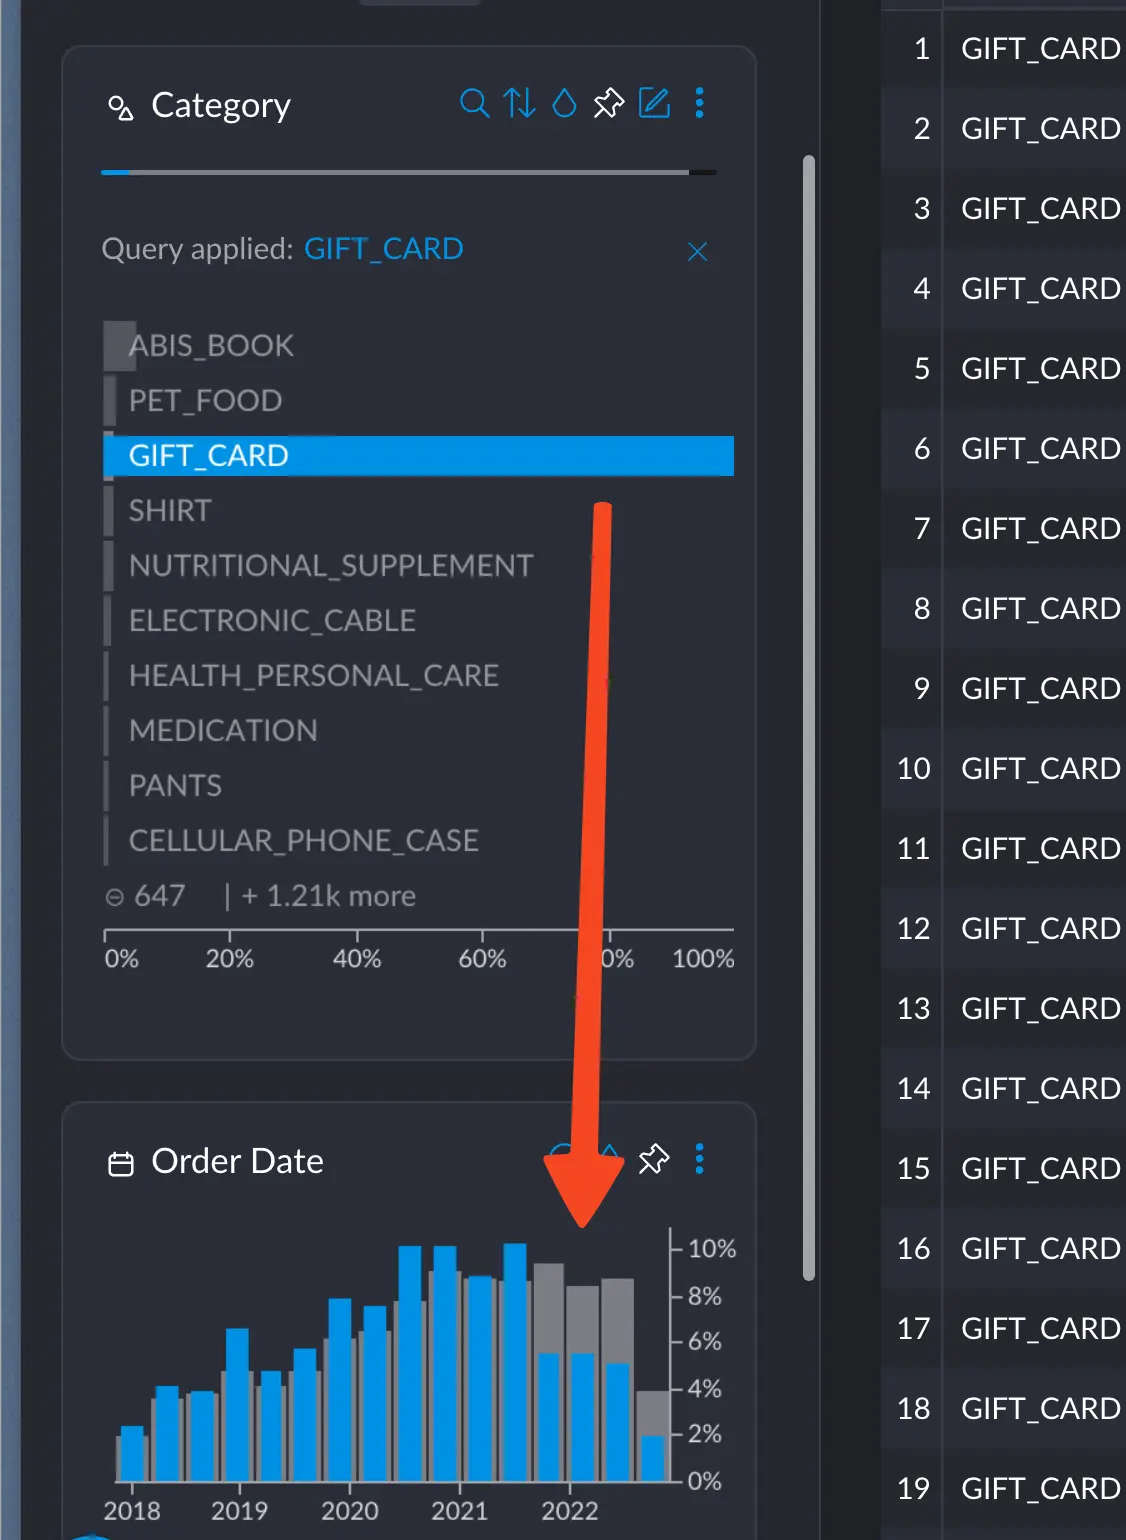 It is worth noting that using cross filters affects the whole state of the application, meaning that Graph and Plot also react
to whatever you are selecting.
## Sorting and filtering
Cross filters can also be sorted and searched, making surgically precise questions a breeze to answer.
### Sorting
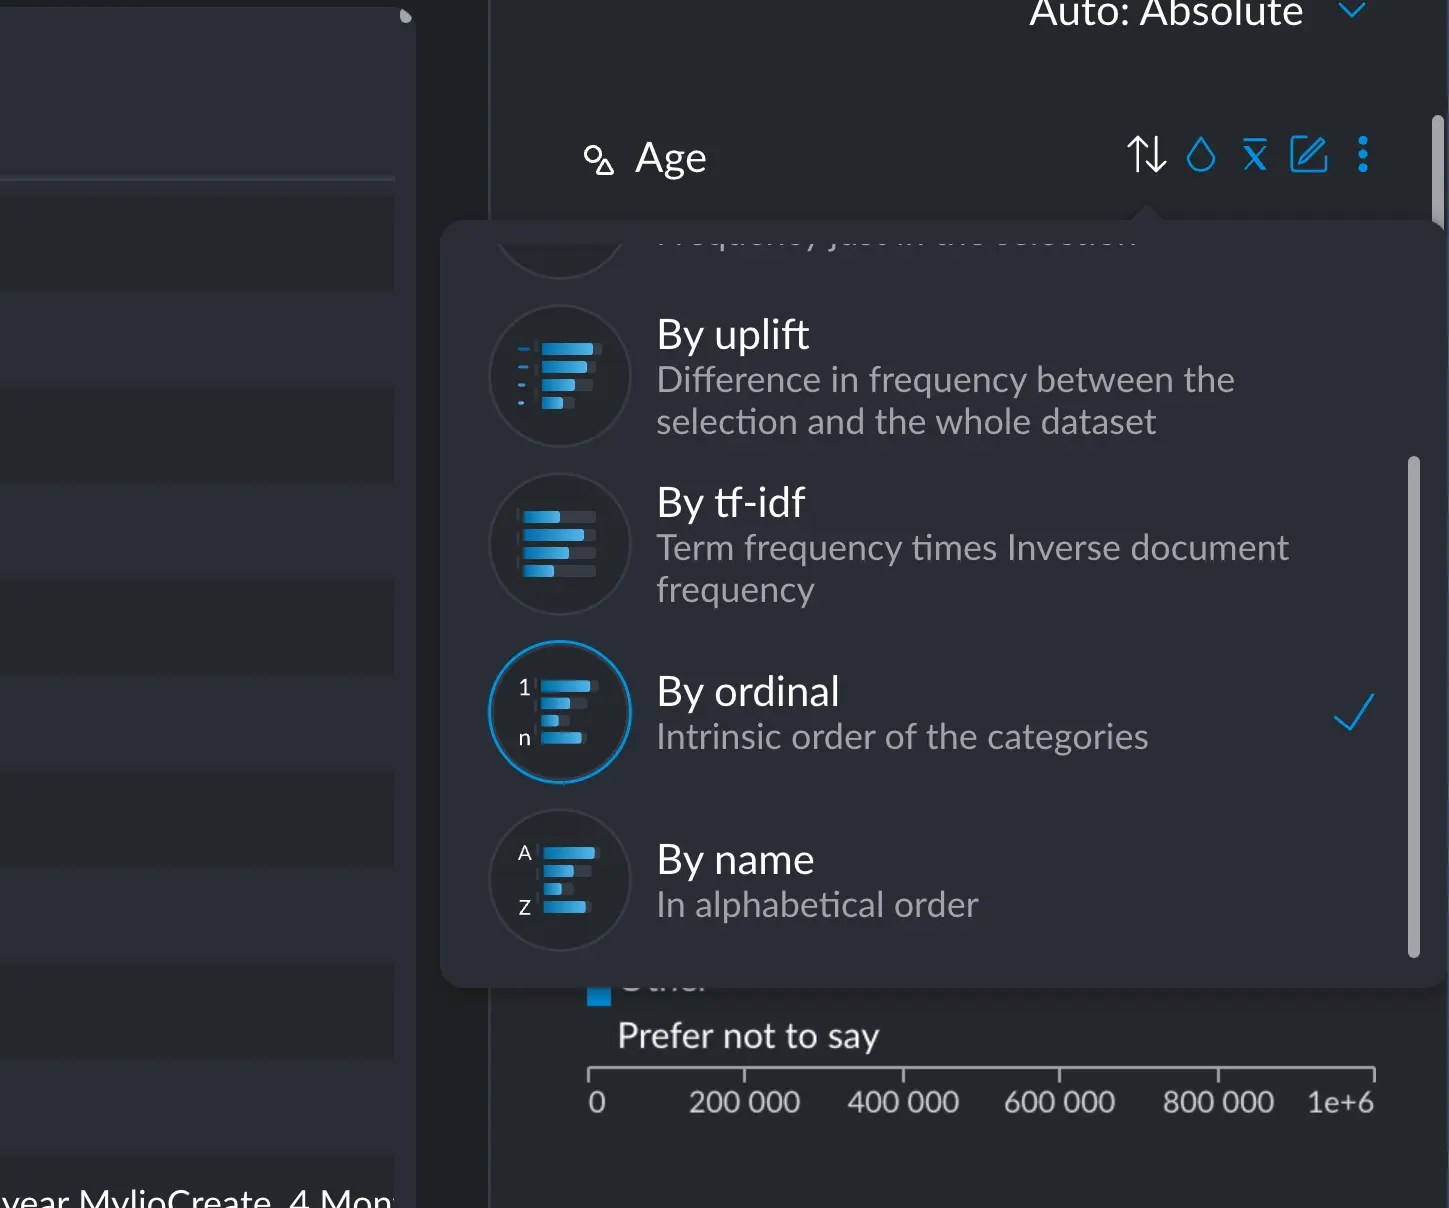
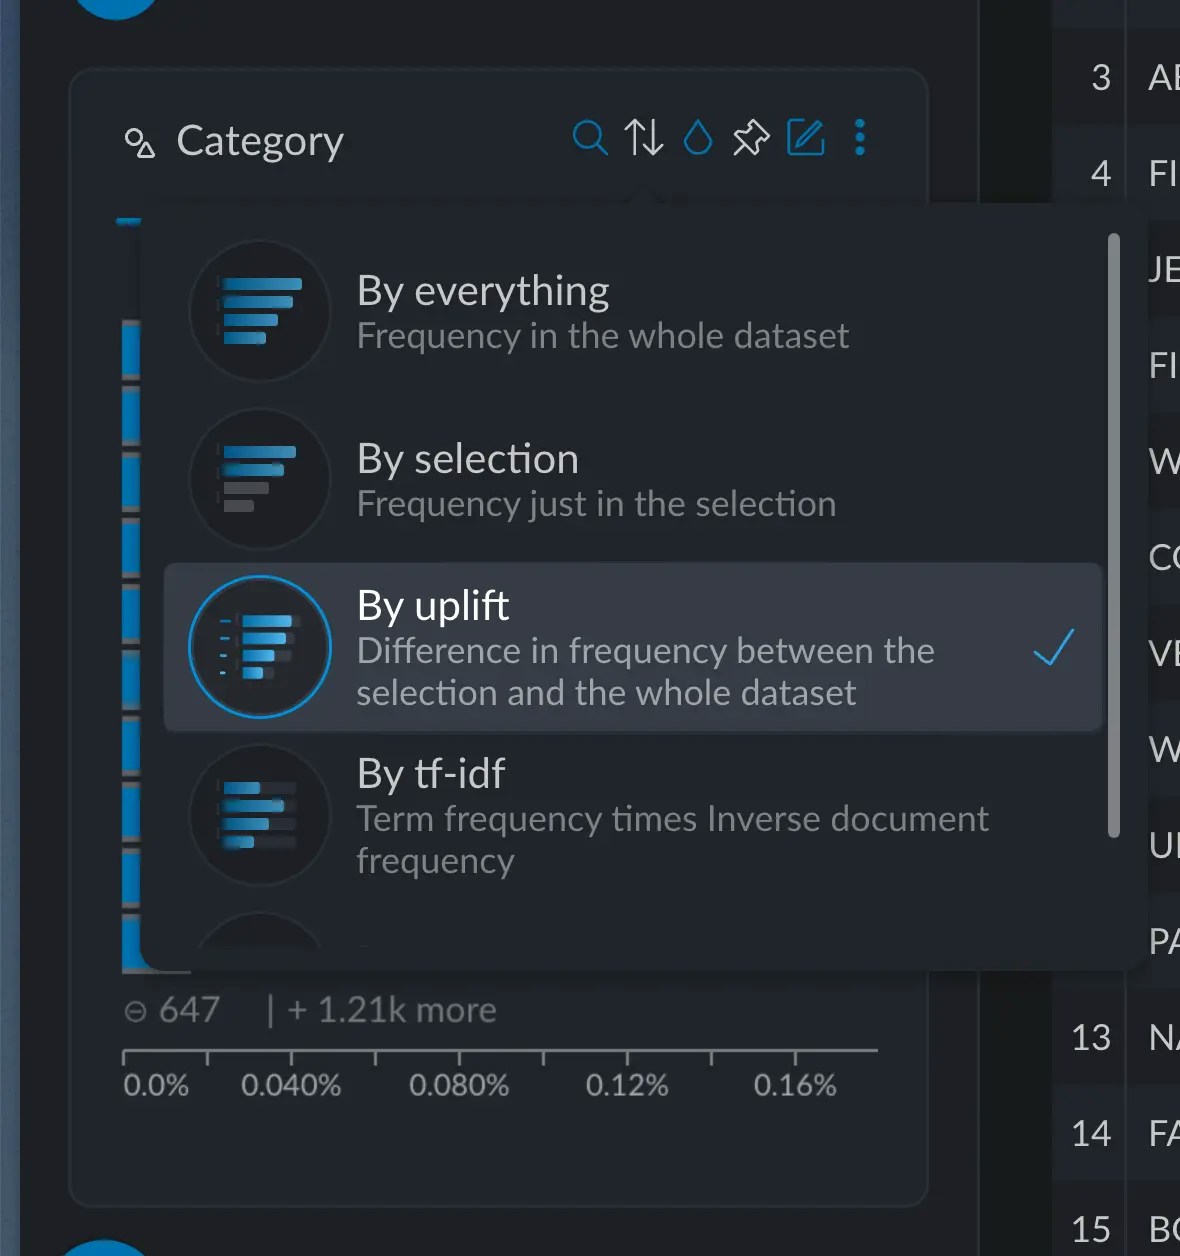
You can sort categorical and text variables, in several ways. The default is "by everything", which just means the frequency
of each value sorted in descending order; the most common items appear first.
You also have these other methods available:
* **Selection**: the same as "by everything" but just taking into account the current active selection
* **Uplift**: the difference in frequency between the selection and the whole dataset. Bigger differences will appear first.
* [TF-IDF](https://en.wikipedia.org/wiki/Tf%E2%80%93idf): measures the importance of a term (or category) with respect to the whole dataset.
* **Ordinal**: if you have [provided ordinal information](/documentation/data-preparation/variable-management-ui-config/specify-order-in-column) to your variable, you can sort it this way.
* **Alphabetically**: sort the categories alphabetically in descending order.
It is worth noting that using cross filters affects the whole state of the application, meaning that Graph and Plot also react
to whatever you are selecting.
## Sorting and filtering
Cross filters can also be sorted and searched, making surgically precise questions a breeze to answer.
### Sorting
You can sort categorical and text variables, in several ways. The default is "by everything", which just means the frequency
of each value sorted in descending order; the most common items appear first.
You also have these other methods available:
* **Selection**: the same as "by everything" but just taking into account the current active selection
* **Uplift**: the difference in frequency between the selection and the whole dataset. Bigger differences will appear first.
* [TF-IDF](https://en.wikipedia.org/wiki/Tf%E2%80%93idf): measures the importance of a term (or category) with respect to the whole dataset.
* **Ordinal**: if you have [provided ordinal information](/documentation/data-preparation/variable-management-ui-config/specify-order-in-column) to your variable, you can sort it this way.
* **Alphabetically**: sort the categories alphabetically in descending order.
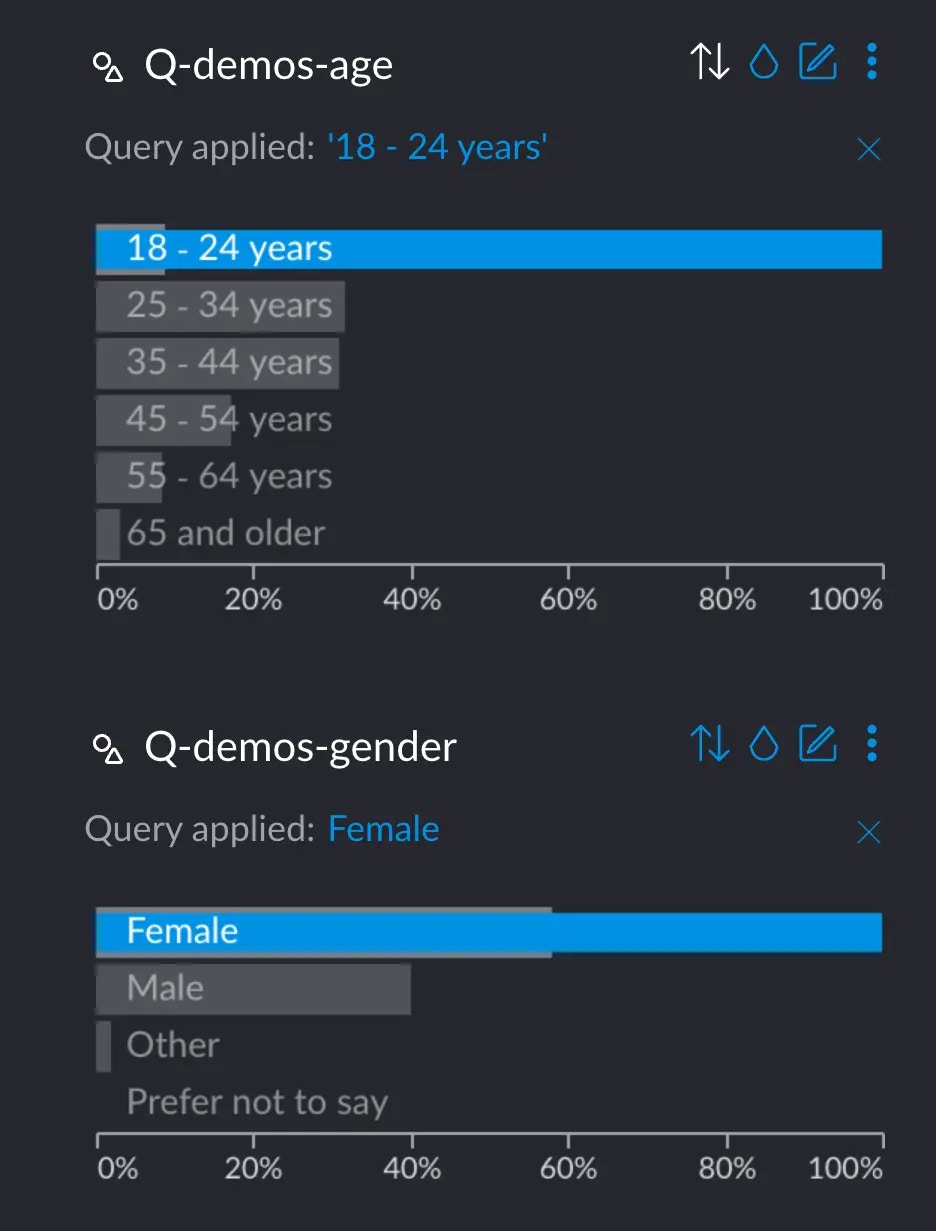
For example, say we select this specific demographic of women between the age 18 and 24.
 we can see how the category column changes based on this information, and sorting it according to the most
relevant data. That is, the one that differs most with respect the whole dataset, without selection.
If we sort Category based on Uplift, we see interesting stuff:
we can see how the category column changes based on this information, and sorting it according to the most
relevant data. That is, the one that differs most with respect the whole dataset, without selection.
If we sort Category based on Uplift, we see interesting stuff:
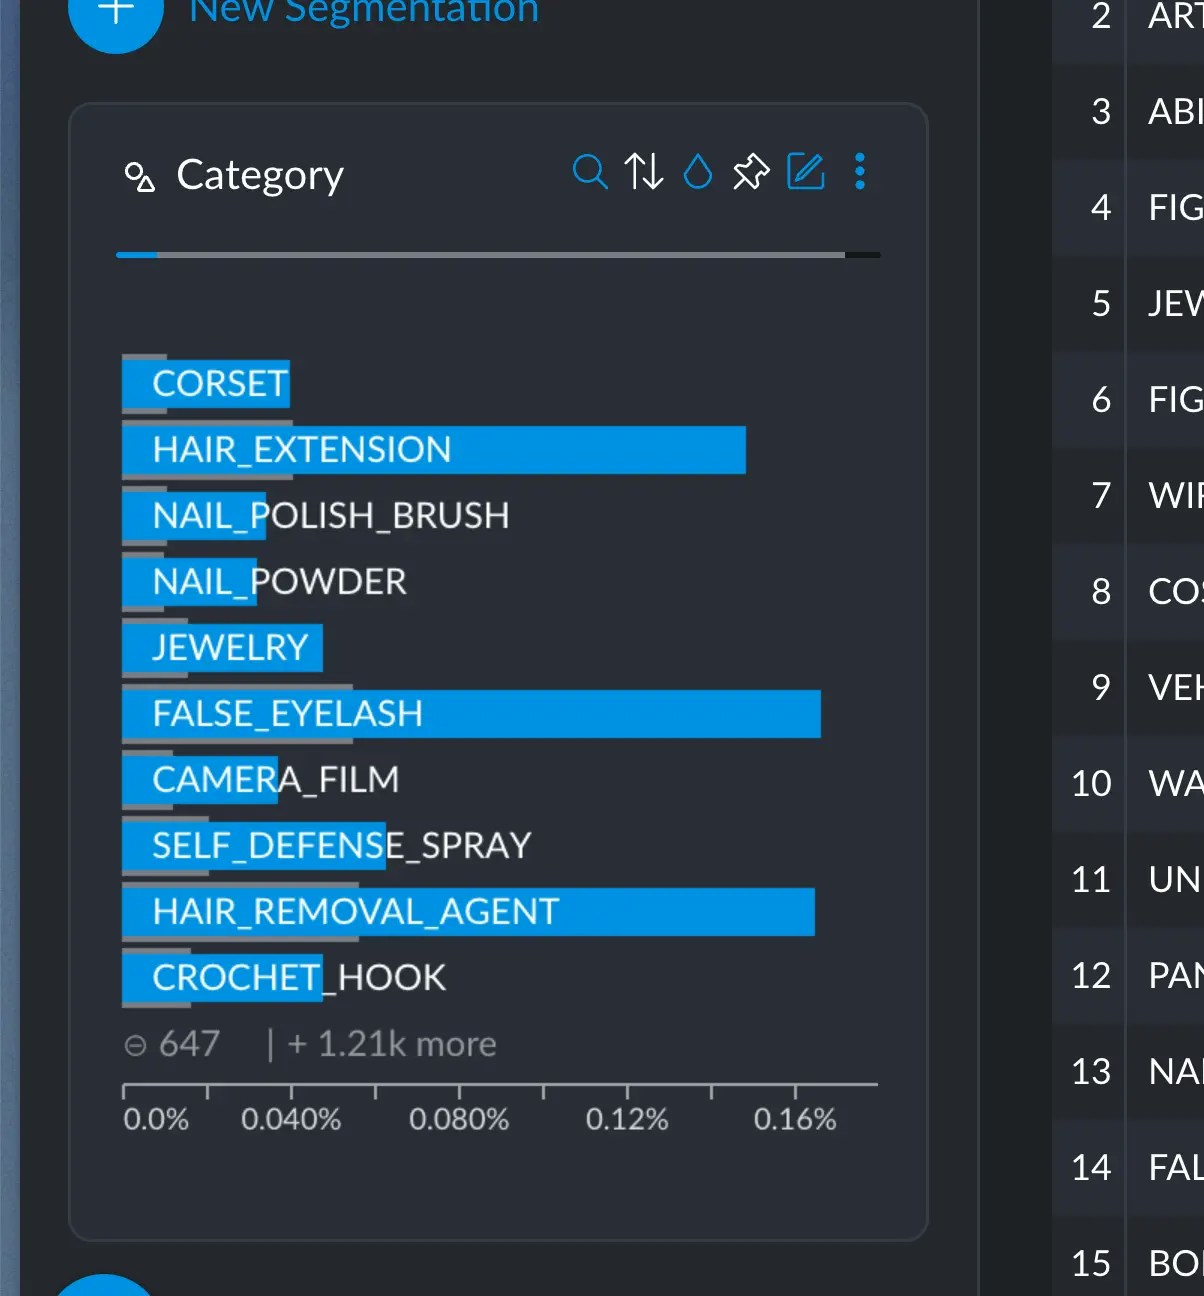 corsets, jewlery and hair extensions come as one of the most distictive results for this specific
subset of data. Which, indeed makes sense.
{" "}
Remember we are not sorting by frequency (since that's the default), but
rather by how different this distribution is with respect to the original
dataset, with no filters.
These results must be taken with a grain of salt, since most of these bars are representing tens or hundreds of datapoints,
which are completely dwarfed by the scale of the million datapoints we have. While promising, they represent a **very** small portion of our
population. Take this into account in your own research.
### Selecting
Clicking the little magnifying glass in a cross filter will allow you to search through the different values it holds:
corsets, jewlery and hair extensions come as one of the most distictive results for this specific
subset of data. Which, indeed makes sense.
{" "}
Remember we are not sorting by frequency (since that's the default), but
rather by how different this distribution is with respect to the original
dataset, with no filters.
These results must be taken with a grain of salt, since most of these bars are representing tens or hundreds of datapoints,
which are completely dwarfed by the scale of the million datapoints we have. While promising, they represent a **very** small portion of our
population. Take this into account in your own research.
### Selecting
Clicking the little magnifying glass in a cross filter will allow you to search through the different values it holds:
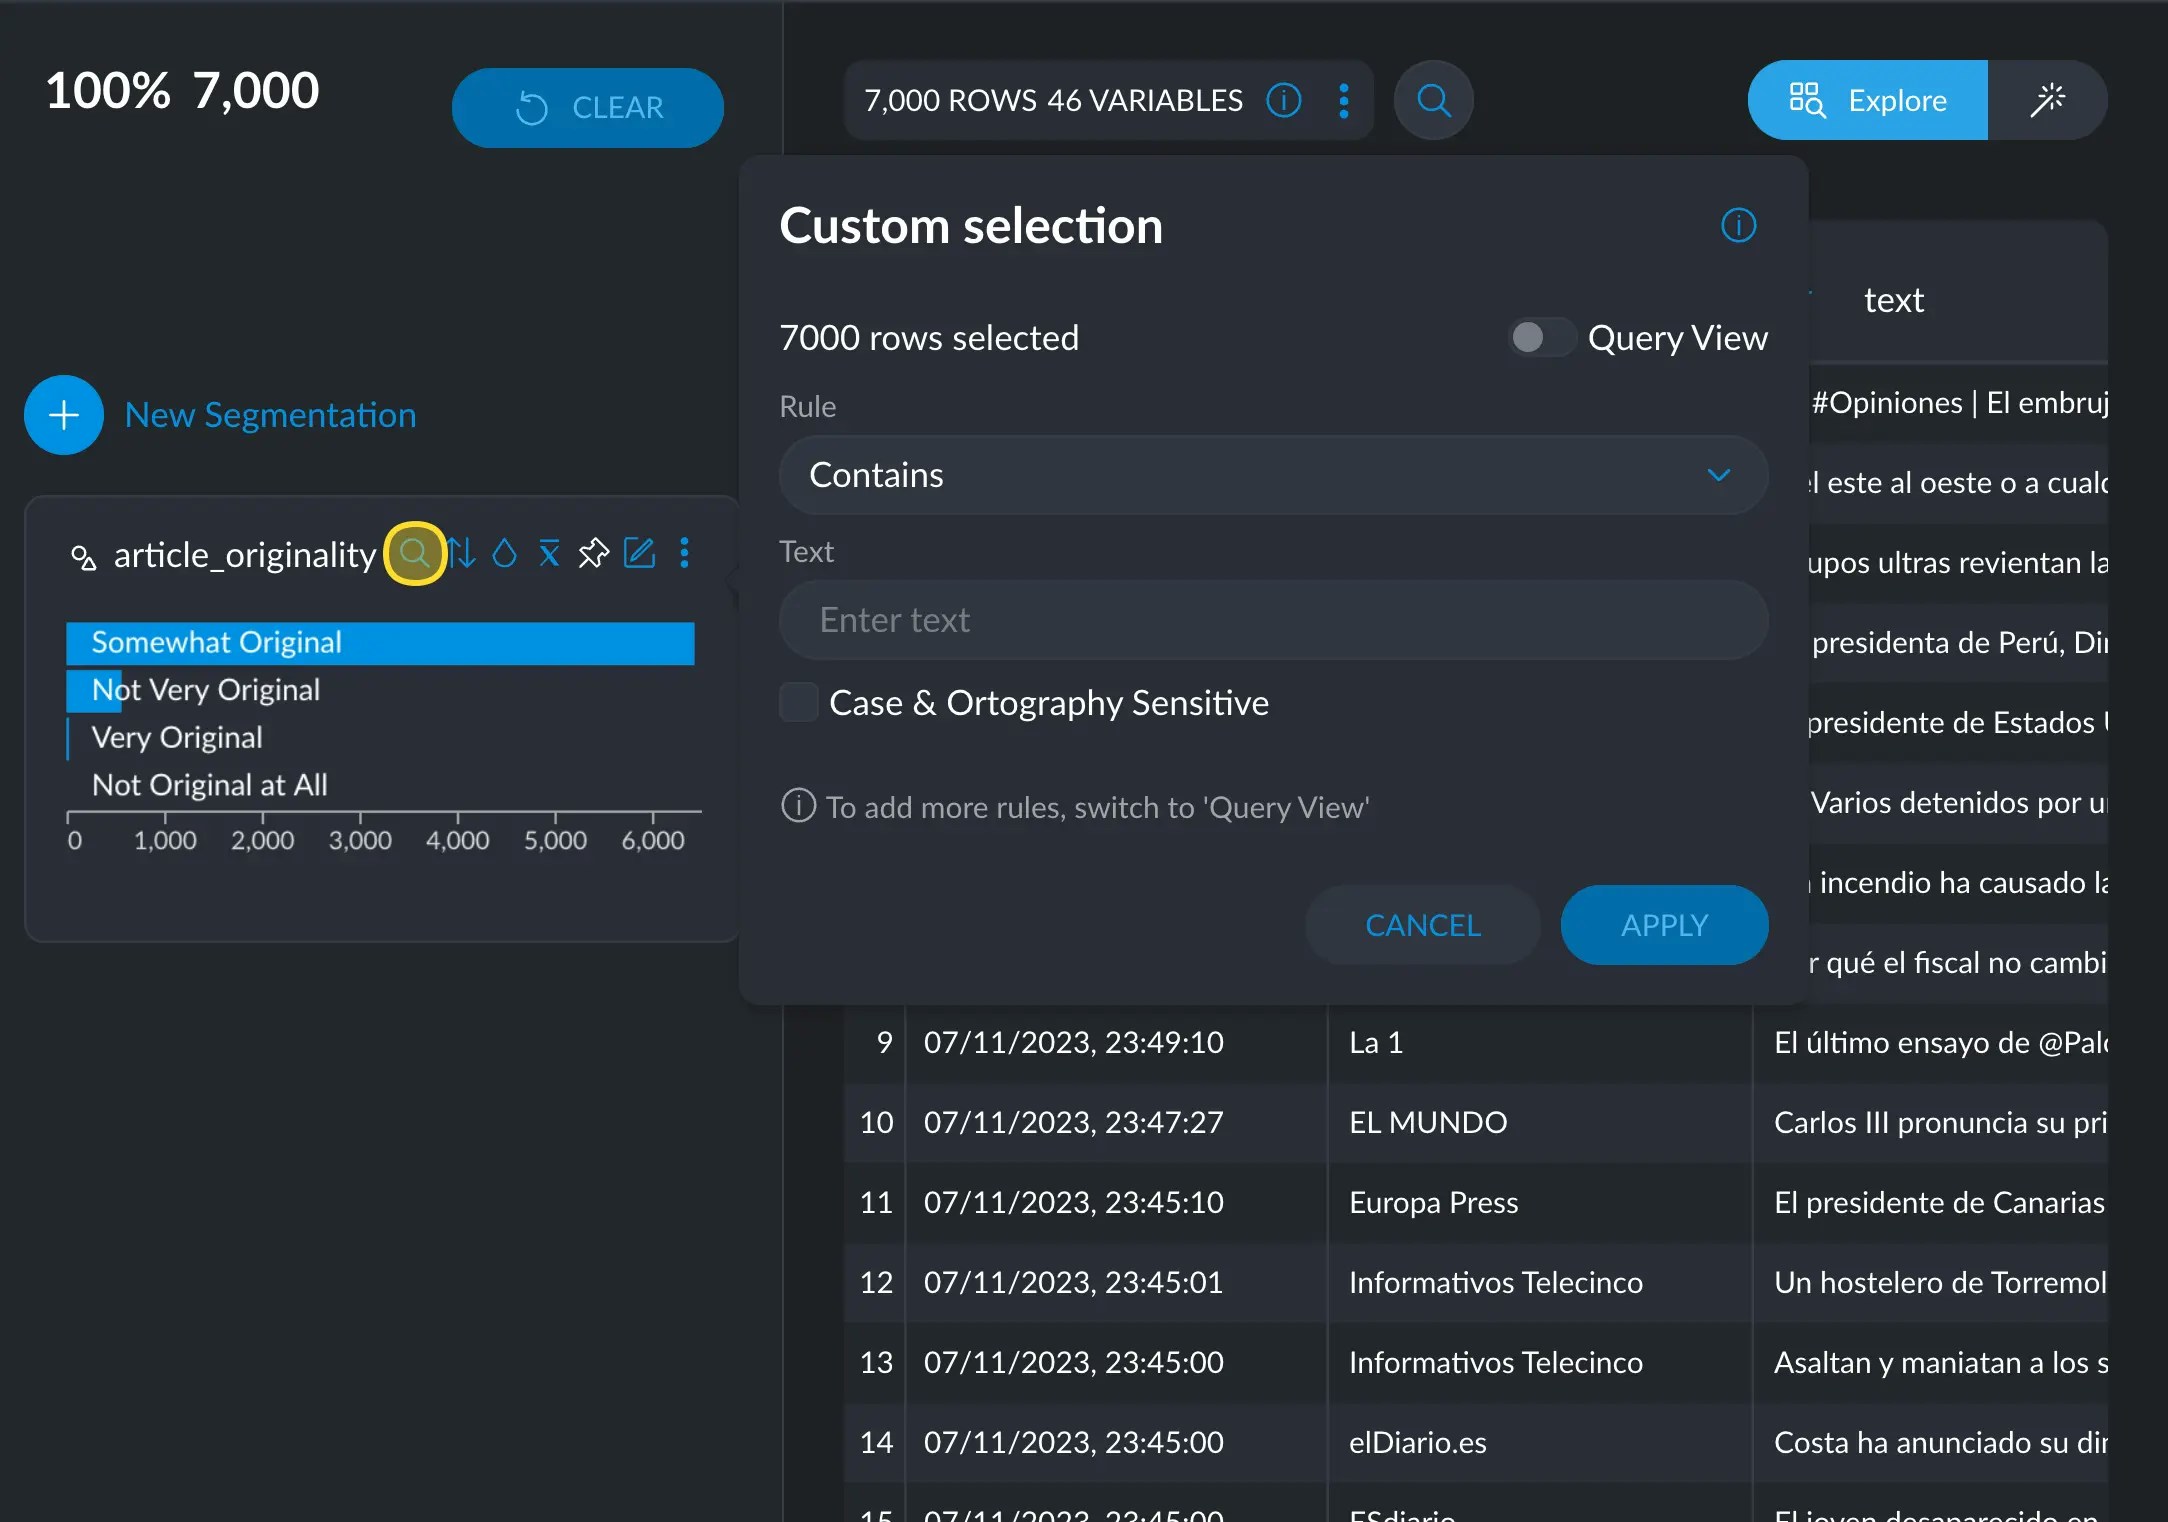 This popup allows you to select any segment belonging to that column. You can
select different rules for searching, like exact match, or contains. This just
translates your choices to an [advanced filter query](/documentation/data-exploration/advanced-filter-queries).
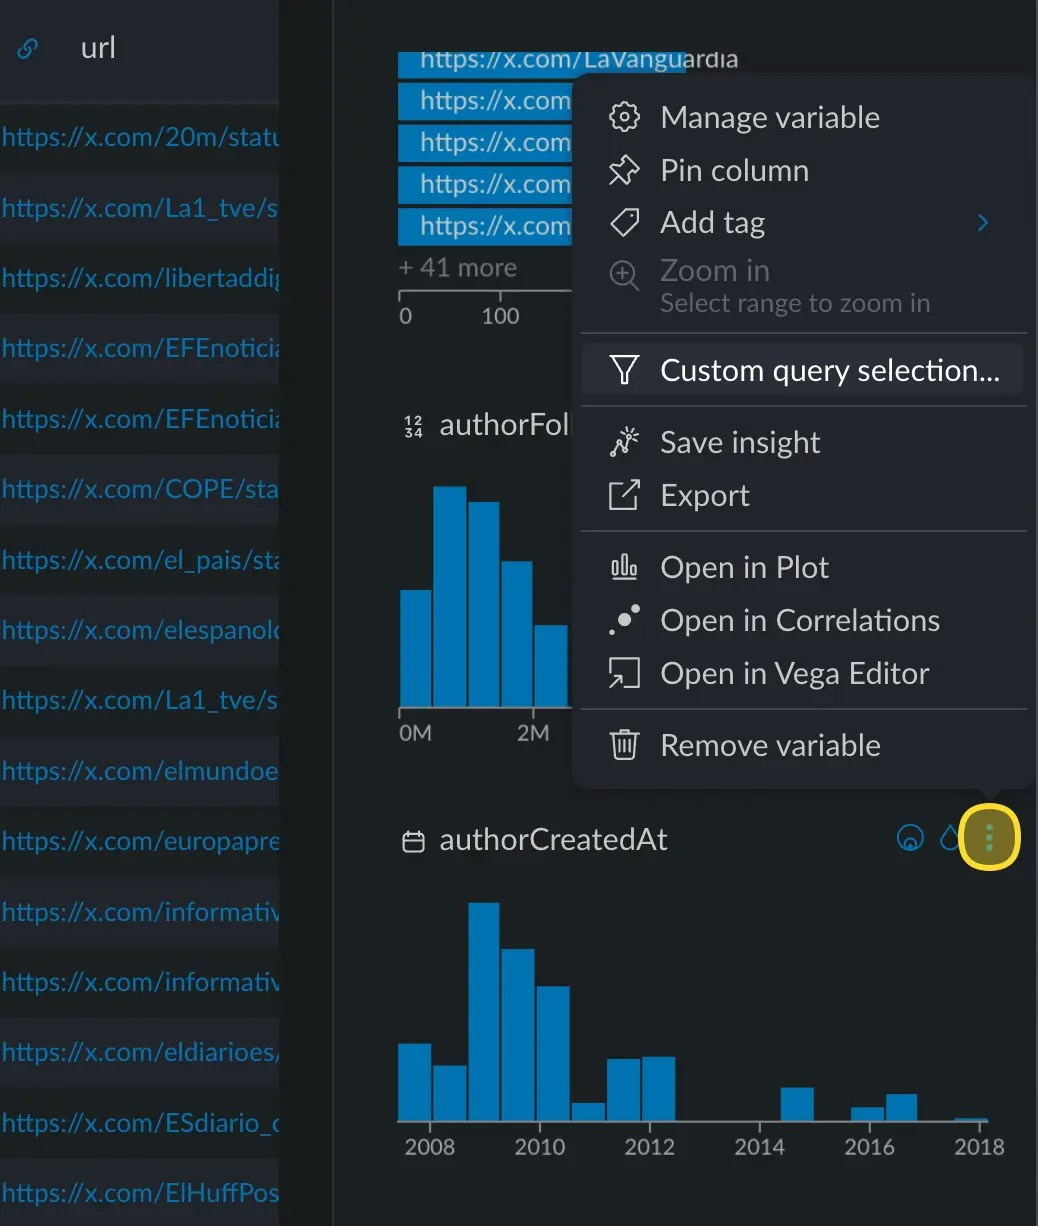
This magnifying glass is only available in text-based variables, like `text` or
`category`. In `numerical` or `date` variables, you can access it via the options
menu → Custom query selection.
This popup allows you to select any segment belonging to that column. You can
select different rules for searching, like exact match, or contains. This just
translates your choices to an [advanced filter query](/documentation/data-exploration/advanced-filter-queries).
This magnifying glass is only available in text-based variables, like `text` or
`category`. In `numerical` or `date` variables, you can access it via the options
menu → Custom query selection.
 ## Re-ordering cross filters
Just in case you missed it, you can [group](/documentation/data-preparation/variable-management-ui-config/group-variables), [pin](/documentation/data-preparation/variable-management-ui-config/pin-variables-menu) and [rearrange variables](/documentation/data-preparation/variable-management-ui-config/arrange-variables-menu), so the most important information
is always where you want it to be.
## Re-ordering cross filters
Just in case you missed it, you can [group](/documentation/data-preparation/variable-management-ui-config/group-variables), [pin](/documentation/data-preparation/variable-management-ui-config/pin-variables-menu) and [rearrange variables](/documentation/data-preparation/variable-management-ui-config/arrange-variables-menu), so the most important information
is always where you want it to be.