> ## Documentation Index
> Fetch the complete documentation index at: https://docs.graphext.com/llms.txt
> Use this file to discover all available pages before exploring further.
# Cross Filters
> Quickly filter and select data
Cross filters are arguably one of the most powerful features in Graphext. It's as
simple as it sounds: it filters your data given some criterion. It's the way in which
we define these criterion that is so powerful.
You can **chain** however many filters you want, hence the 'cross filter' naming. This allows
you to hone in to a very thin slice of your data that responds to only the criterion you've
selected. Changing, removing and iterating on this selection is as simple as a couple clicks,
which makes data exploration extremely fast.
To filter a column, you can simply interact with the little chart that's
associated to it.
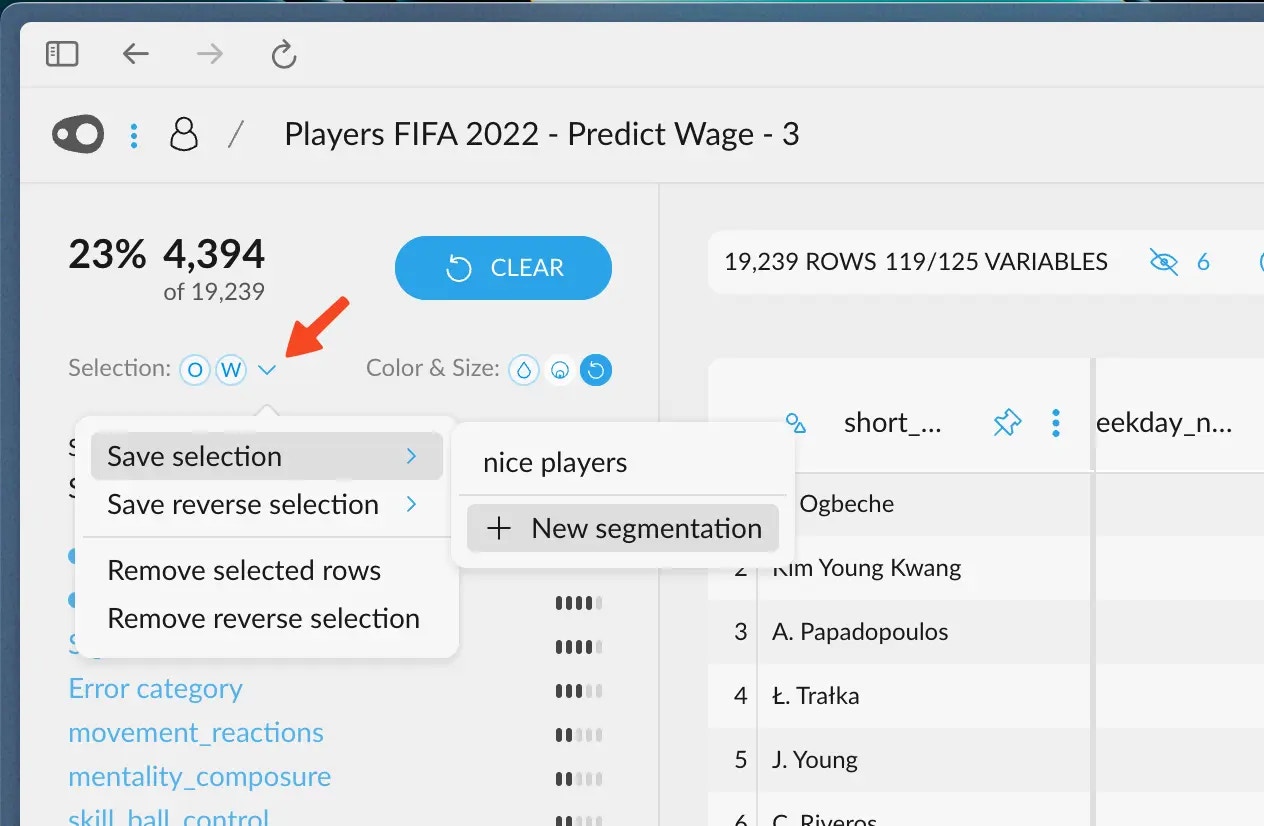
In the case you reach to a particular selection you may want to preserve, you can do so by
clicking on the little dropdown arrow in the top left corner. This will save the current selection
as a [segment](/concepts/graphext-concepts/segments).
 ## Absolute and Relative percentages
Upon filtering, all the other variables react to the filter. They show the relative
percentage of entries that fall into their respective categories, effectively showing
you a real-time distribution of the selected data, but in every other column.
To bring it home, let's see this example.
## Absolute and Relative percentages
Upon filtering, all the other variables react to the filter. They show the relative
percentage of entries that fall into their respective categories, effectively showing
you a real-time distribution of the selected data, but in every other column.
To bring it home, let's see this example.
 ### Example: Host Acceptance Rate
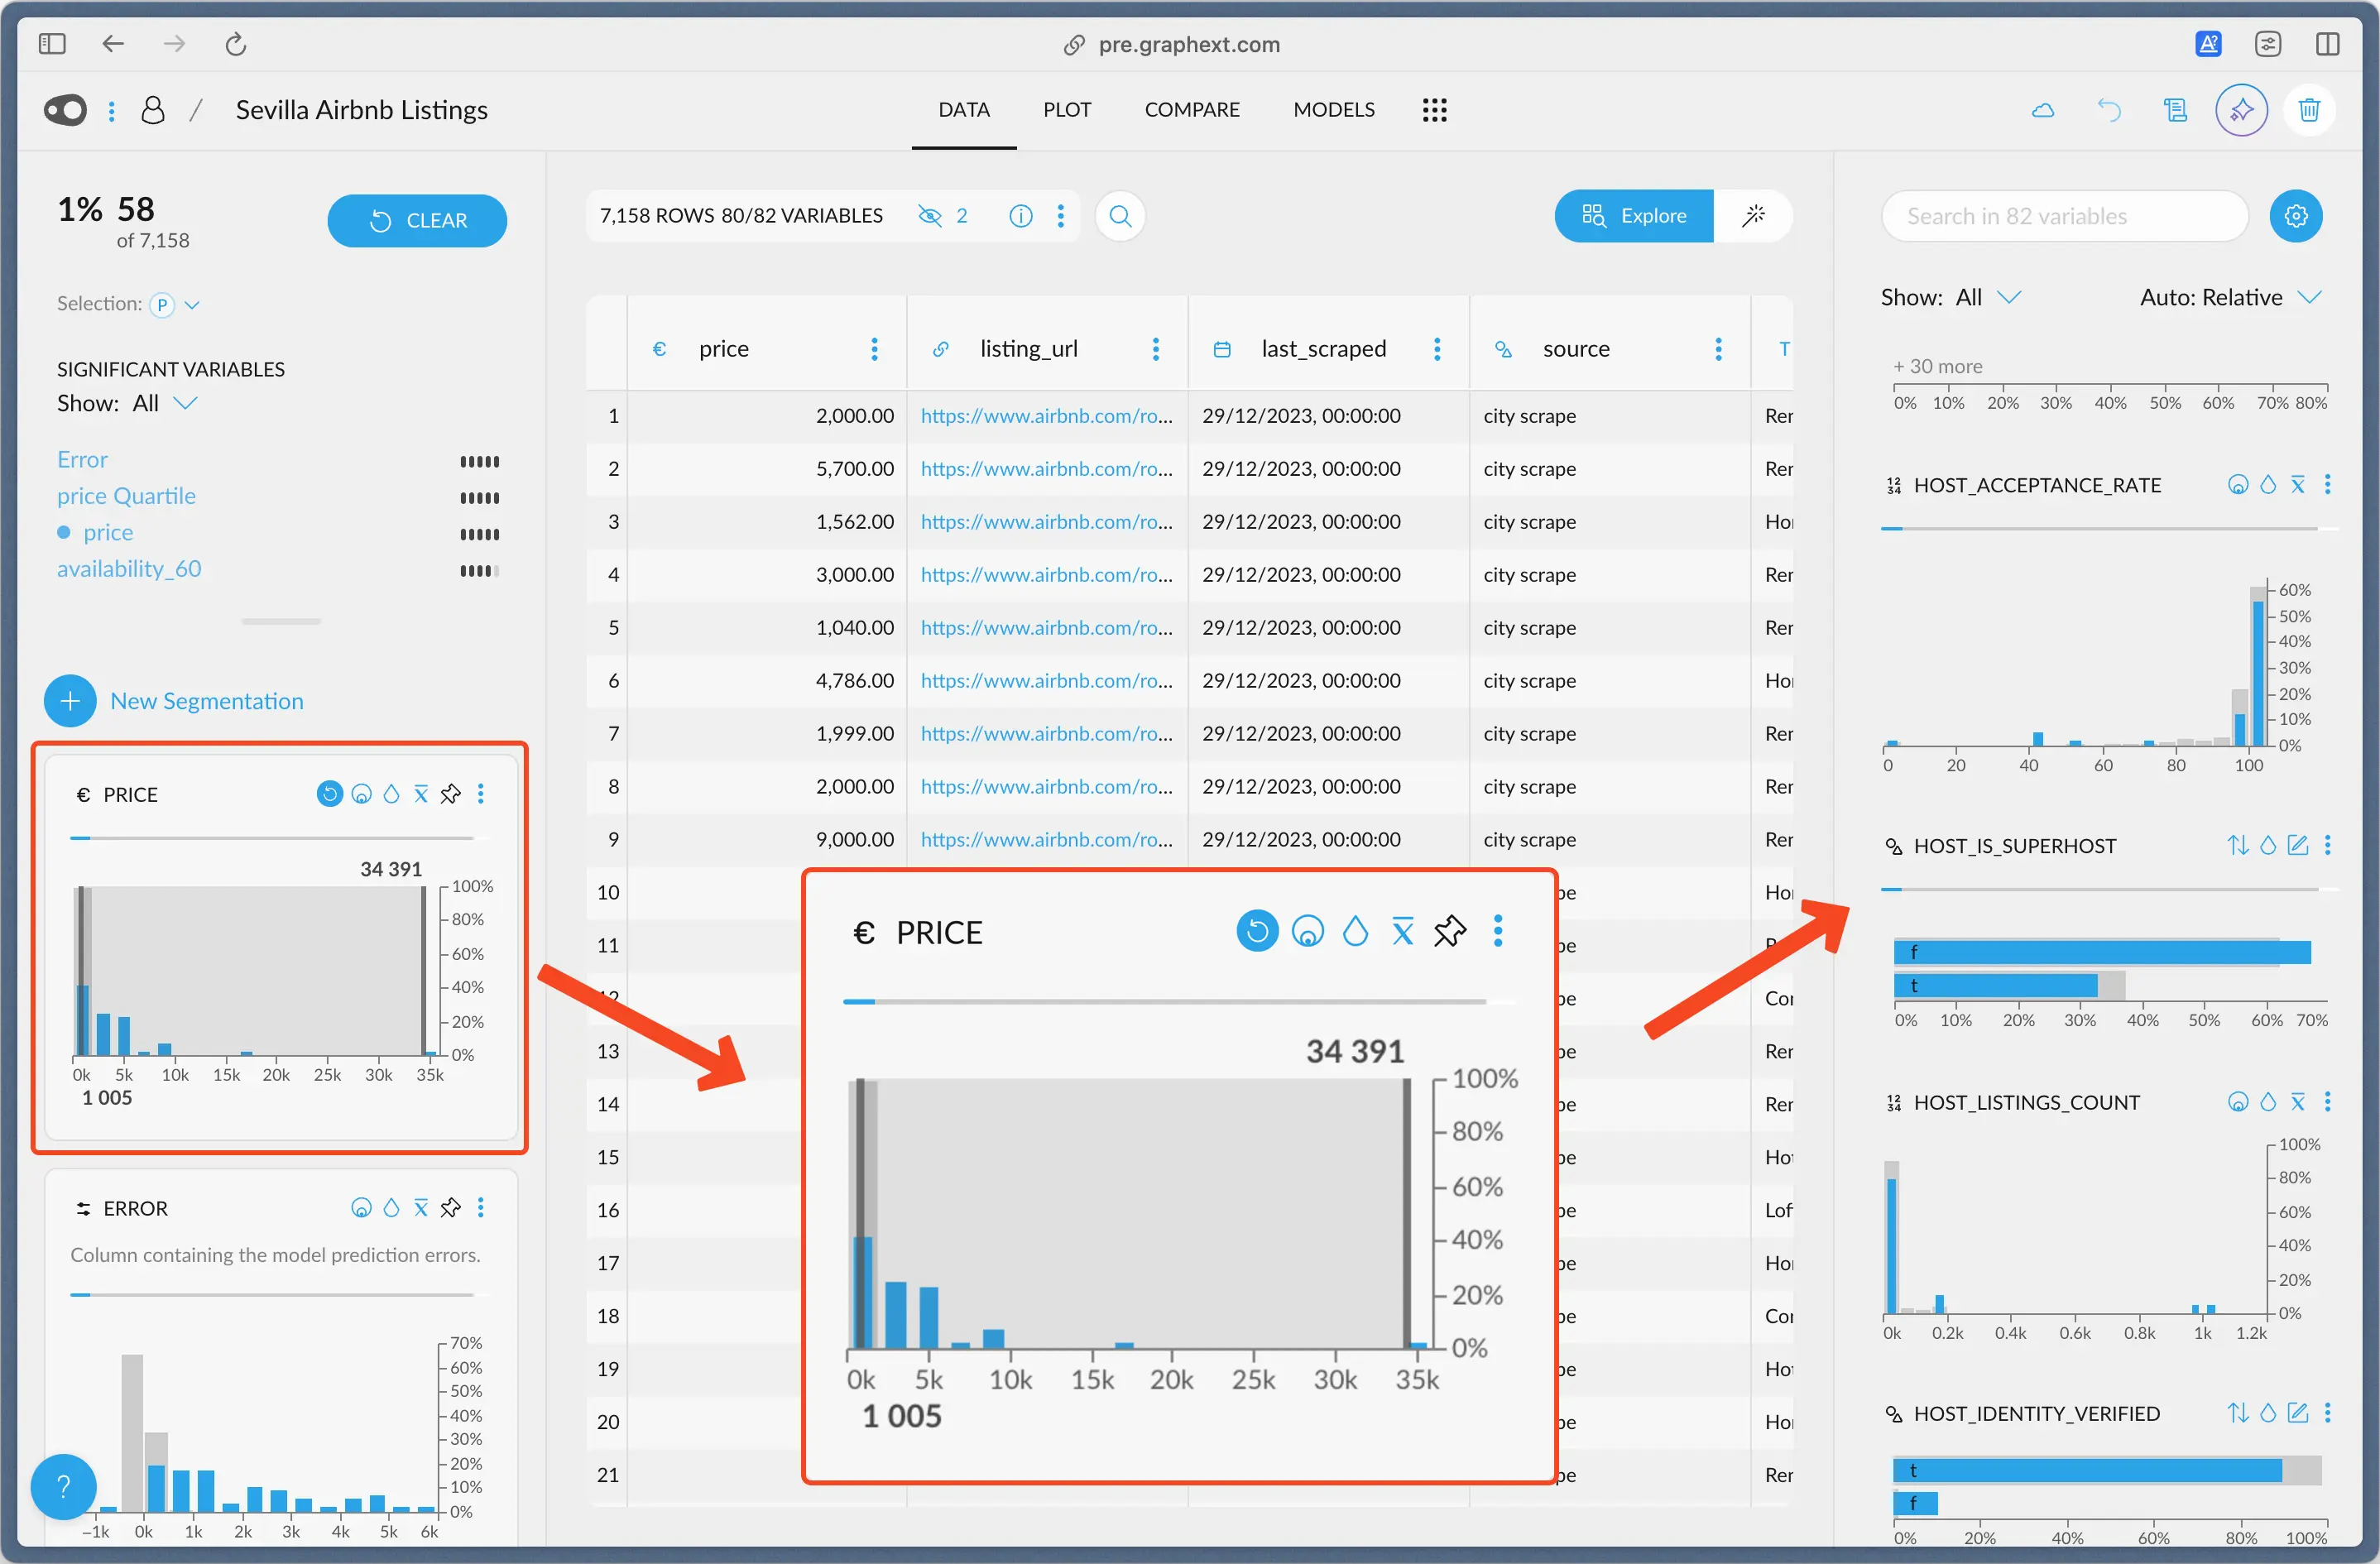
Upon filtering the price, we see the histogram for `host_acceptance_rate` changed.
Now, it shows a percentage y-scale. The gray bars that sit *in the background*
correspond to the percentage of entries that lie in that bin, had we **NOT** filtered the data.
We can see that the last bar, which corresponds to an acceptance rate range from 100
to 110, goes to just over 60%. That means that over 60% of all the hosts have an
acceptance rate of 100 or more.
The blue bar *on top* indicates the percentage of entries that lie in that bin,
**out of the current selection**. Around 55% of the 58 rows we have selected
lie in that acceptance rate range. That's around \~31 rows.
### Example: Is Super Host
Another example is the `is_super_host` variable, just under it. This variable is
either true (t) or false (f) indicating if the host is marked as a Super Host.
In the whole dataset, around 63% of the hosts are not Super Hosts (f). However,
in our particular selection, this is accentuated. Around 70% of the entries **we have
selected** are not Super Hosts. This can be of relevance, depending the questions
we are asking.
The opposite also applies: the percentage of hosts in our selection is
less than the percentage of hosts in the entire dataset.
## Significant Variables
Also, the [significant variables](/concepts/graphext-concepts/significant-variables) kick-in, showing
what other variables may be interesting in regards to the selected one.
### Example: Host Acceptance Rate
Upon filtering the price, we see the histogram for `host_acceptance_rate` changed.
Now, it shows a percentage y-scale. The gray bars that sit *in the background*
correspond to the percentage of entries that lie in that bin, had we **NOT** filtered the data.
We can see that the last bar, which corresponds to an acceptance rate range from 100
to 110, goes to just over 60%. That means that over 60% of all the hosts have an
acceptance rate of 100 or more.
The blue bar *on top* indicates the percentage of entries that lie in that bin,
**out of the current selection**. Around 55% of the 58 rows we have selected
lie in that acceptance rate range. That's around \~31 rows.
### Example: Is Super Host
Another example is the `is_super_host` variable, just under it. This variable is
either true (t) or false (f) indicating if the host is marked as a Super Host.
In the whole dataset, around 63% of the hosts are not Super Hosts (f). However,
in our particular selection, this is accentuated. Around 70% of the entries **we have
selected** are not Super Hosts. This can be of relevance, depending the questions
we are asking.
The opposite also applies: the percentage of hosts in our selection is
less than the percentage of hosts in the entire dataset.
## Significant Variables
Also, the [significant variables](/concepts/graphext-concepts/significant-variables) kick-in, showing
what other variables may be interesting in regards to the selected one.